
Travel & Leisure Co. Weathering Expense Headwinds While Boosting Revenue
The company delivered solid revenue growth in FY2025 despite significant operating profit contraction driven by rising expenses.
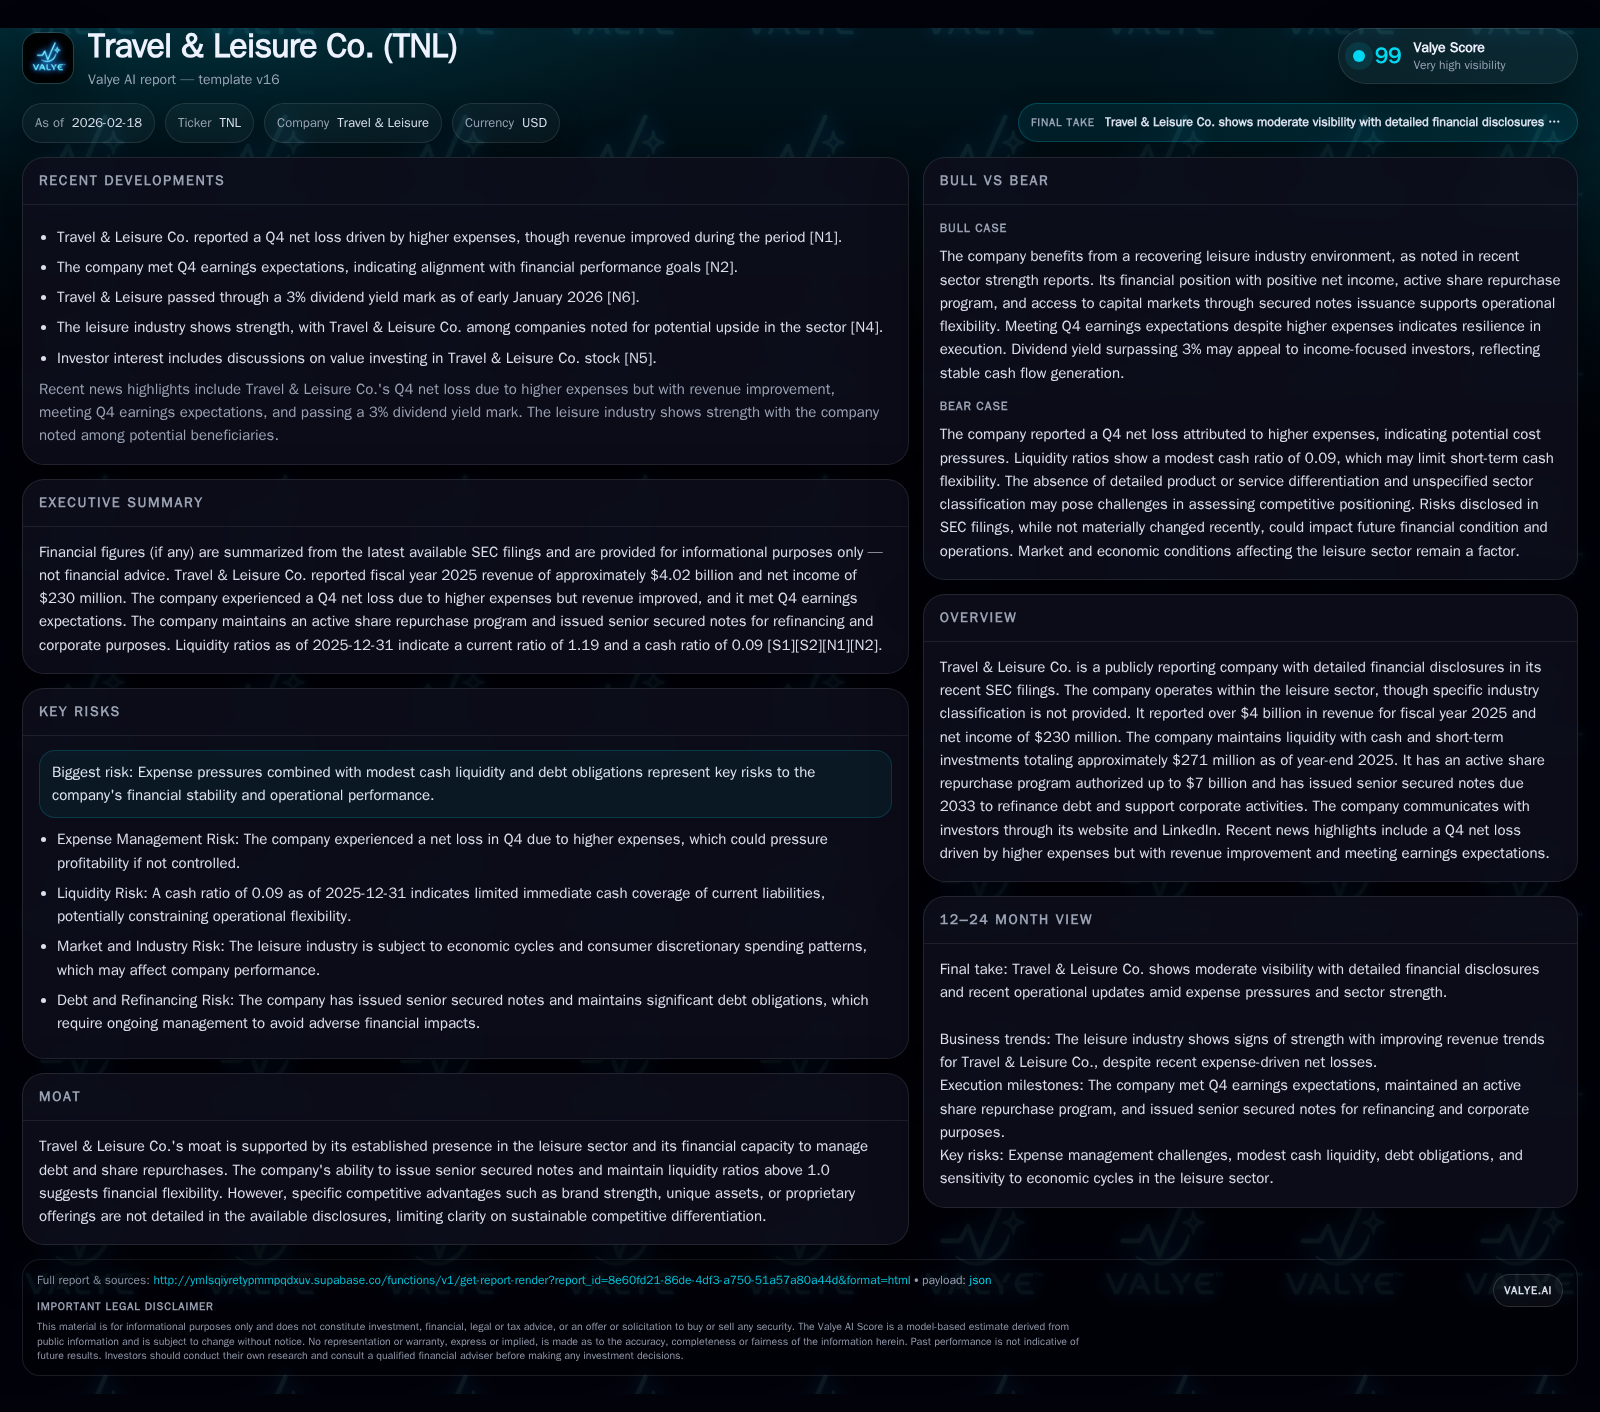
Travel & Leisure Co. reported a 4.1% revenue increase to over $4 billion in fiscal 2025, demonstrating ongoing demand strength in the leisure market. However, operating income declined by nearly 25%, with net income falling 44%, reflecting amplified cost pressures. Operating cash flow grew strongly, supporting higher capital expenditures and sustained shareholder returns through dividends and buybacks. The firm maintains liquidity at approximately $253 million in cash and equivalents and has actively refinanced debt via senior secured notes due 2033. Capital allocation balances steady dividends with aggressive share repurchases under an expanded $7 billion authorization program, underscoring management's commitment to shareholders amid profitability challenges. Return on equity was negative, reflecting losses relative to equity base. Free cash flow remains positive at $523 million. Expense inflation and moderate cash buffers are key risks to monitor going forward.
Revenue Expansion Versus Operating Profit Decline: The Latest Financial Results
Travel & Leisure Co.’s fiscal year 2025 results demonstrate a clear divergence between top-line growth and profitability pressures. Revenues increased by 4.1% to $4.02 billion, reflecting resilient demand across its leisure offerings [F1]. Despite this increase, operating income decreased sharply by 24.6% to $553 million, driven by elevated operating expenses including inflationary labor and supply costs as well as strategic investments [F1]. Net income fell by 44% to $230 million, underscoring the impact of margin compression.
Historical performance (annual)
| FY | Rev ($bn) | Net ($mm) | CFO ($mm) | OpInc ($mm) | Rev YoY | Net YoY |
|---|---|---|---|---|---|---|
| 2025 | 4.0 | 230 | 640 | 553 | +4.1% | -44.0% |
| 2024 | 3.9 | 411 | 464 | 733 | +3.0% | +3.8% |
| 2023 | 3.8 | 396 | 350 | 720 | +5.1% | +10.9% |
| 2022 | 3.6 | 357 | 442 | 653 |
Note: Omitted columns lack sufficient annual XBRL coverage in the provided tags (need ≥2 annual points): Capex. Source: SEC companyfacts cache [F1].
Capital returns and efficiency (annual)
| FY | Div ($mm) | Buybacks ($mm) | FCF ($mm) |
|---|---|---|---|
| 2025 | 149 | 301 | 523 |
| 2024 | 142 | 234 | 383 |
| 2023 | 136 | 309 | 276 |
| 2022 | 135 | 351 | 390 |
Source: SEC companyfacts cache [F1].
This divergence highlights that rising expenses offset gains from revenue growth.
Drivers of Growth and Expense Escalation
Management commentary during the Q4 earnings call noted that revenue strength stemmed from sustained customer engagement post-pandemic recovery phases and favorable market dynamics [N1][N3]. However, operating expenses rose significantly due to inflationary pressures on labor and supplies combined with targeted investments in service capacity expansion and technology upgrades [N1].
Risk disclosures emphasize expense inflation as a material risk factor impacting margins adversely [S5], consistent with the observed contraction in operating profit.
Financial Liquidity and Debt Refinancing
The company held approximately $253 million in cash and cash equivalents at the end of FY2025, contributing to a current ratio around 1.19 based on available data [F1]. This liquidity provides a reasonable buffer for near-term obligations.
In August and December 2025, Travel & Leisure Co. issued $500 million senior secured notes due in 2033 bearing interest around 6.125%, using proceeds primarily to redeem all outstanding secured notes maturing in October 2025 and reduce revolver borrowings [S7][S8][S11][S12]. This refinancing extends debt maturities materially, reducing near-term refinancing risk.
The indenture includes covenants restricting additional secured debt incurrence and sale-leaseback transactions, balancing creditor protections with operational flexibility [S7][S8].
Capital Allocation: Dividends Steady Amid Increased Buybacks
Despite profitability pressures, the company maintained dividend payments close to prior-year levels at about $149 million in FY2025, supporting shareholder confidence [F1][S4][S6].
Simultaneously, share repurchases accelerated to $301 million in FY2025 from $234 million the prior year under an expanded share repurchase authorization program currently capped at $7 billion following multiple increases including a recent $500 million boost in May 2024 [F1][S4][S6].
This reflects management’s preference for returning capital even amid earnings challenges.
| Fiscal Year | Operating Cash Flow (USD mn) | CFO YoY % | Capex (USD mn) | Capex YoY % | Dividends Paid (USD mn) | Share Repurchases (USD mn) |
|---|---|---|---|---|---|---|
| 2025 | 640 | +37.9% | 117 | +44.4% | 149 | 301 |
| 2024 | 464 | 81 | 142 | 234 | ||
| 2023 | 350 | 74 | 136 | 309 | ||
| 2022 | 442 | 52 | 135 | 351 |
Increased capital expenditures reflect reinvestment into property and equipment assets necessary for capacity enhancements or modernization efforts.
Returns Metrics: Negative ROE Reflects Equity Deficit
The company’s stockholders’ equity was negative at approximately -$981 million as of FY2025 year-end [F1], resulting in an approximate return on equity of -23.4% based on net income for FY2025 [F1]. This negative ROE signals losses relative to the equity base.
Free cash flow, calculated as operating cash flow minus capital expenditures, stood at roughly $523 million for FY2025 indicating solid cash generation despite earnings pressure [F1].
Risks Related to Expense Inflation and Moderate Liquidity Buffers
Expense inflation remains a principal operational risk flagged by management given its potential to compress EBITDA margins if not offset by pricing or productivity improvements [S5].
While liquidity is moderate with about $253 million in cash equivalents, this level combined with ongoing expense pressures limits the cushion available for unexpected disruptions or rapid strategic changes.
The recent refinancing improves maturity profiles but does not eliminate exposure to market conditions affecting future borrowing costs or access.
Outlook Considerations: Monitoring Margins and Capital Allocation Discipline
No explicit formal guidance was provided for upcoming periods within filings or news releases; investors should closely monitor quarterly results for signs of margin recovery or further expense escalation [N7][S3].
Analysts anticipate gradual profitability improvement as investments yield operational efficiencies balanced against persistent inflation risks [N7]. Capital return policies are expected to remain disciplined with dividends steady but buyback volumes potentially adjusted based on liquidity conditions.
Key Milestones: Debt Maturities and Earnings Updates Ahead
Upcoming maturities under term loan facilities toward the late decade timeframe warrant attention alongside quarterly earnings updates which may provide insight into progress managing costs versus revenue growth initiatives [S12][N5].
Changes in shareholder return programs such as repurchase authorizations or dividend policy could also signal management’s confidence or caution tied to evolving cash flows.
Investors are advised to track official SEC filings and investor presentations on travelandleisureco.com for timely disclosures given limited forward guidance currently available publicly [S15][S17].
Disclaimer: This analysis is informational only and does not constitute investment advice or recommendations.
Disclaimer: This is research-only, informational analysis and not investment advice. It may include AI-generated interpretation and general industry context. Always verify important details using primary sources.
Comments