
Knight-Swift's Scale and Segmentation Drive Operational Complexity Amid Margin Pressure
2025 marked modest revenue growth but sharp profit contraction due to impairments and integration costs.
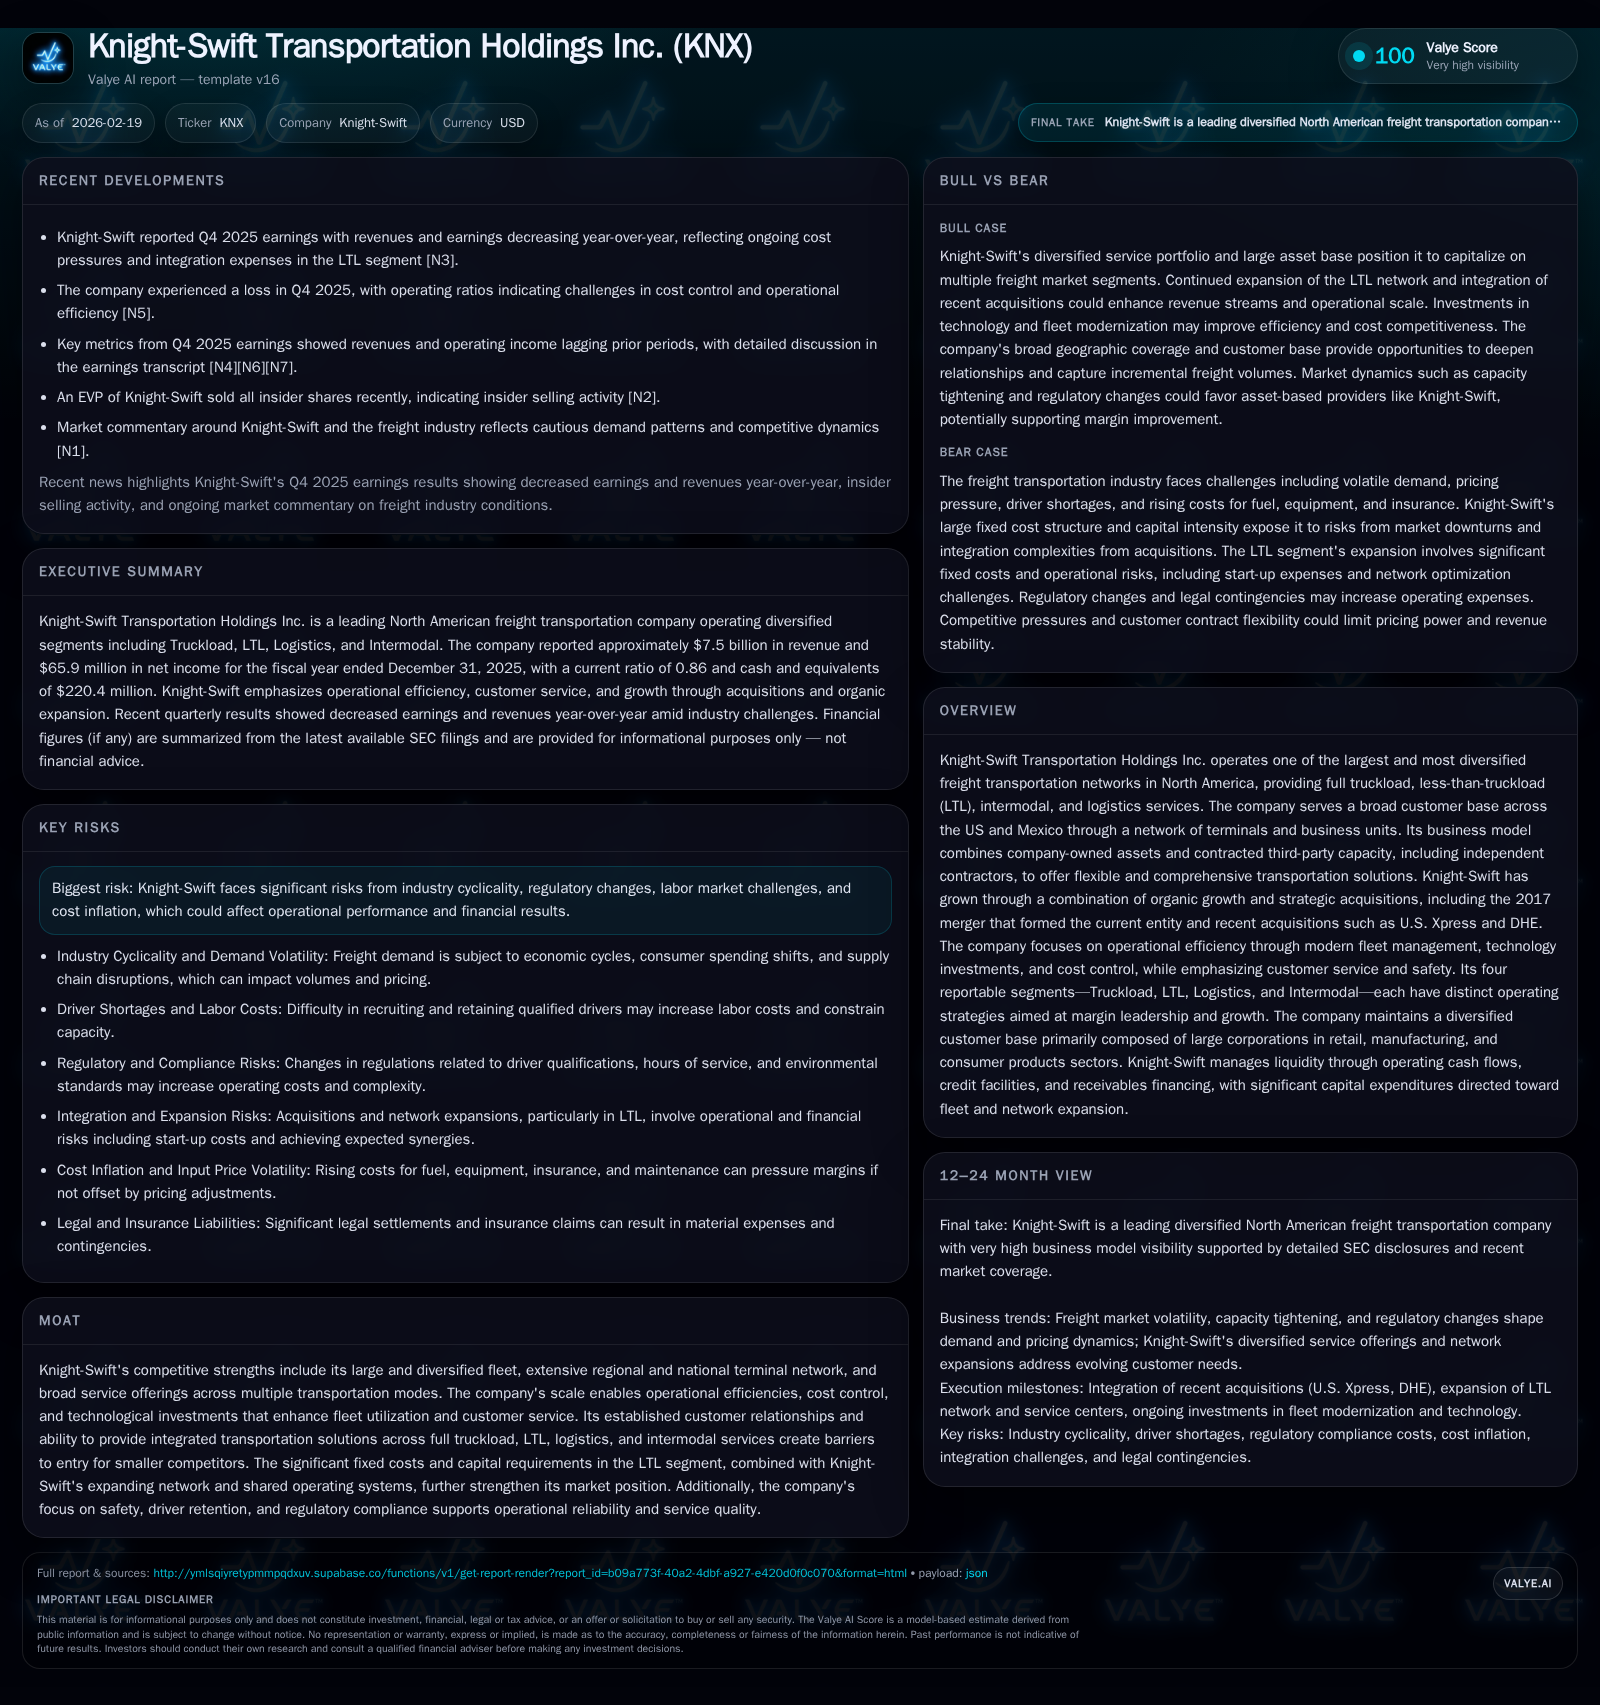
Knight-Swift Transportation Holdings Inc. reported $7.47 billion in 2025 revenue, up less than 1% year-over-year, while operating income declined by over 11%, pressured by asset impairments and costs related to recent acquisitions. The company maintains a diversified transportation network covering full truckload, less-than-truckload (LTL), logistics, and intermodal services across North America. Despite near-term profitability challenges especially in LTL integration and intermodal headwinds, robust operating cash flows support ongoing capital expenditures targeting fleet modernization and network expansion. Future growth is expected from continued LTL expansion, enhanced technology investments, and operational optimization, although risks persist from cyclical freight demand, regulatory shifts, and labor market pressures.
Company Overview
Knight-Swift Transportation Holdings Inc. stands as one of North America's largest freight transportation providers with a highly diversified service portfolio spanning full truckload (FTL), less-than-truckload (LTL), intermodal rail services, and logistics coordination. The company operates a sizeable mixed fleet of company-owned tractors alongside contracted independent operators, allowing comprehensive geographic coverage throughout the U.S. and Mexico [S6][F1]. Since its formation through the merger of Knight Transportation and Swift Transportation in 2017, Knight-Swift has grown organically while also executing strategic acquisitions such as U.S. Xpress (2023) and DHE (2024) that have expanded both capacity and service breadth [S1][S22].
The company's mission focuses on leading industry margins while expanding scale across transportation modes to provide efficient supply chain solutions for a diverse customer base primarily concentrated in retail, food & beverage, automotive, manufacturing, consumer products, and logistics sectors [S10].
Historical Financial Performance
Historical performance (annual)
| FY | Rev ($bn) | Net ($mm) | CFO ($mm) | OpInc ($mm) | Rev YoY | Net YoY |
|---|---|---|---|---|---|---|
| 2025 | 7.5 | 66 | 1267 | 216 | +0.8% | -43.9% |
| 2024 | 7.4 | 118 | 799 | 243 | +3.8% | -45.8% |
| 2023 | 7.1 | 217 | 1162 | 338 | -3.9% | -71.8% |
| 2022 | 7.4 | 771 | 1436 | 1092 |
Note: Omitted columns lack sufficient annual XBRL coverage in the provided tags (need ≥2 annual points): Capex, FCF. Source: SEC companyfacts cache [F1].
Capital returns and efficiency (annual)
| FY | Div ($mm) | Buybacks ($mm) | ROE% |
|---|---|---|---|
| 2025 | 117 | 0.9 | |
| 2024 | 104 | 0 | 1.7 |
| 2023 | 91 | 0 | 3.1 |
| 2022 | 78 | 300 | 11.1 |
Source: SEC companyfacts cache [F1].
¹ Detailed current capex data not provided annually post-2019; recent guidance indicates ~600-$675 million range annually [S8][S16] ² Relates to unusual items impacting operating income such as impairments or tax impacts
Knight-Swift’s reported revenues demonstrated remarkable stability despite macroeconomic cyclicality with incremental growth of under one percent in FY25 versus FY24 [F1]. This reflects an environment where freight volumes remained steady but pricing faced pressure amid evolving supply-demand dynamics.
However, profitability has exhibited pronounced volatility mostly attributable to non-cash impairments linked to acquired brands consolidation (notably DHE rebranding under AAA Cooper) and real estate assets as well as elevated integration expenses within the LTL segment during facility rollouts [S1]. Operating income declined over eleven percent year-over-year while net profits contracted nearly fifty percent compared to the prior year.
Strong cash flows from operations reaching approximately $1.27 billion—an increase of nearly 60%—attest to effective working capital management alongside core business cash generation despite earnings pressure [F1]. Capital expenditures have been increasing per latest guidance reflecting substantial reinvestment into equipment renewals aimed at fuel efficiency gains and service quality improvements within key segments including Truckload and LTL.
Business Segments Dynamics
Knight-Swift reports four main segments: Truckload, LTL, Logistics, and Intermodal.
Truckload: Operating an average fleet exceeding 21,000 tractors combined of company-owned and independent contractor assets with approximately 85,000 trailers serving nationwide dense lanes enables high asset utilization efficiencies and customization for customers including refrigerated cargos and expedited freight [S6][S22]. Strategic focus remains on disciplined lane selection with multi-year dedicated contracts ensuring predictable revenues.
LTL: Formed largely through acquisitions since FY21 (ACT Acquisition), further enlarged by DHE in mid-2024; it operates more than 4,100 tractors across an expanding network of service centers now approaching nationwide scope with focus on throughput growth amid margin recovery from early-stage facility costs tied to new site openings (~60%) [S12][S15]. Integration efforts continue challenging returns short term.
Logistics: Features lower fixed asset intensity relying on advanced IT platforms that coordinate brokerage capacity leveraging third-party carriers; segment revenues are sensitive to load count fluctuations but maintain stable adjusted operating ratios near mid-90 range with modest revenue per load gains reported recently showing operational discipline [S14].
Intermodal: Complementary to Truckload focused on long-haul rail combined drayage transport using owned trailing equipment; experiencing revenue headwinds from load count decreases despite slight increases in rates per load due to shifting customer behaviors favoring direct trucking or network disruptions; this segment carries high purchased transportation variable costs limiting upside until rail market conditions stabilize [S14][S23].
Growth Prospects and Strategy
Knight-Swift envisions growth driven by:
- LTL Network Expansion: Continued facility rollout aiming at comprehensive national brand presence leveraging enterprise-wide integrated operating systems that promise economies of scale once new locations mature operationally.
- Technology Investments: Automation in dispatching optimization, telematics for driver safety/fuel efficiency enhancement programs including idle reduction tech deployment across majority of tractors targeting emissions compliance gains supportive of regulatory trends.
- Fleet Modernization: Significant ongoing capex directed at replacing older tractors/trailers improving maintenance cost structures while enhancing driver recruitment appeal through modern equipment experience.
- Customer Relationship Deepening: Marketing toward existing large customers offering bundled multi-modal transport options backed by a nationwide terminal presence catering notably to retail/distribution chains requiring reliability amid fluctuating freight patterns.
However growth may be capped or pressured by:
- Industry cyclicality risks where softening demand constrains volume uplift potential;
- Regulatory changes especially around classification of independent contractors (proposed 'ABC Test') creating wage inflation or attrition risks;
- Cost inflation in fuel beyond pass-through surcharges or rising insurance premiums linked to tightened industry underwriting standards;
- Delays or inefficiencies integrating recent acquisitions potentially dragging margins further before synergies materialize [S7][S17][N2][N12].
Returns and Capital Allocation
Return on equity remains low at approximately 0.9% for FY25 given slim net margins impacted by amortization and impairment charges overshadowing core cash-generative operations [F1]. The disparity between robust operating cash flow generation ($1.27 billion) versus GAAP net income ($66 million) highlights significant non-cash adjustments typical for asset-intensive businesses undergoing acquisition-led expansions.
Capital allocation prioritizes fleet upkeep/expansion with planned capex between $625 million-$675 million for fiscal year '26 which exceeds depreciations—indicative of ongoing modernization investment rather than textbook maintenance capex only [S8][S16]. Dividend payments grew modestly by approximately 13% year-over-year reaching about $117 million reflecting steady commitment while share buybacks have been suspended since FY22 reflecting conservative capital deployment amid earnings volatility [F1][S13].
Debt refinancing actions implemented recently via the $2.5 billion credit facility extend maturities out to July 2030 improving liquidity buffers despite carrying roughly $2.9 billion in material debt obligations supporting captive leasing/finance models essential for equipment acquisition scale https://www.nasdaq.com/articles/knight-swift-q4-earnings-miss-estimates-decrease-year-over-year[N2],[N5],[N12],[N13] .
Working capital swings remain manageable though current ratio below parity (circa ~0.86) suggests locomotive-like working capital needs managed largely through revolving credit availability rather than surplus liquidity bucket holding given high-capital intensity nature cut out for trucking operations [F1].
Industry Context & Operational Nuances (Analysis)
In the trucking sector broadly there is upward pressure on driver wages resulting from persistent driver shortages exacerbated by regulatory-driven entry barriers such as mandatory CDL training requirements plus hours-of-service rules limiting driving time per shift/week hindering overall capacity growth rate even during freight demand upticks. Asset utilization efforts like speed governors improving fuel economy or predictive logistics routing help reduce unit costs but cannot fully offset macroeconomic constraints causing margin compression industry-wide.
Fleet age is a salient metric affecting maintenance downtime; Knight-Swift's strategy emphasizes predominantly owned fleets reducing secondhand market dependency particularly important amid volatile used truck pricing seen after pandemic erratic demand cycles. Fleet density by terminal location also affects load factor optimization—high density hubs allow better backhaul match rates minimizing empty miles which constitutes a critical lever in maintaining cost competitiveness. Technological advances combining real-time telemetry data with AI-enhanced dispatch algorithms provide incremental operational leverage yet require upfront costs delaying ROI realization—a factor accentuated within large multi-brand infrastructures like Knight-Swift's arrangement.
What To Watch Forward (Analysis)
Absent explicit long-term financial guidance beyond capex ranges disclosed recently for '26 fiscal year,[S24] future monitoring should focus on:
- Quarterly segment margins especially LTL after initial establishment phases mature;
- Freight tonnage growth trends alongside spot vs contract rate compositions impacting yield;
- Development of regulatory environment around driver classification laws potentially affecting contract labor cost structures;
- Fleet renewal pace alignment with technological adoption milestones targeting emissions regulations;
- Debt leverage metrics incorporating any new acquisition-related borrowing or refinancing moves;
- Customer concentration risk shifts given top five clients comprise ~26% total revenue evidencing certain dependence balancing breadth versus deep relationships[S10];
- Cost inflation pass-through effectiveness especially fuel surcharge mechanism resilience amidst oil price volatilities;
- Integration progress on newly added entities assessing synergy capture potential versus drag effects.
Conclusion
Knight-Swift epitomizes a freight logistics titans' model blending broad multimodal services anchored in a vast physical asset footprint intertwined with an intricate operator-contractor hybrid workforce configuration enabling flexibility but imposing complexity burdens especially amid ongoing integration activities that weigh on near-term earnings quality. While stabilized revenue profiles affirm resilience against cyclical headwinds supported by rising cash flows fueling aggressive reinvestment cycles reinforce its medium-term positioning aimed at national LTL dominance coupled with cross-modal capabilities suited for evolving supply chain demands constrained however by external regulatory landscape uncertainties making investor scrutiny around operational cadence indispensable going forward.
Disclaimer: This analysis is informational only based on public SEC filings and news sources as of early 2026 without providing investment advice.
Disclaimer: This is research-only, informational analysis and not investment advice. It may include AI-generated interpretation and general industry context. Always verify important details using primary sources.
Comments