
TPG Inc. Accelerates Revenue Growth While Managing Regulatory and Liquidity Challenges
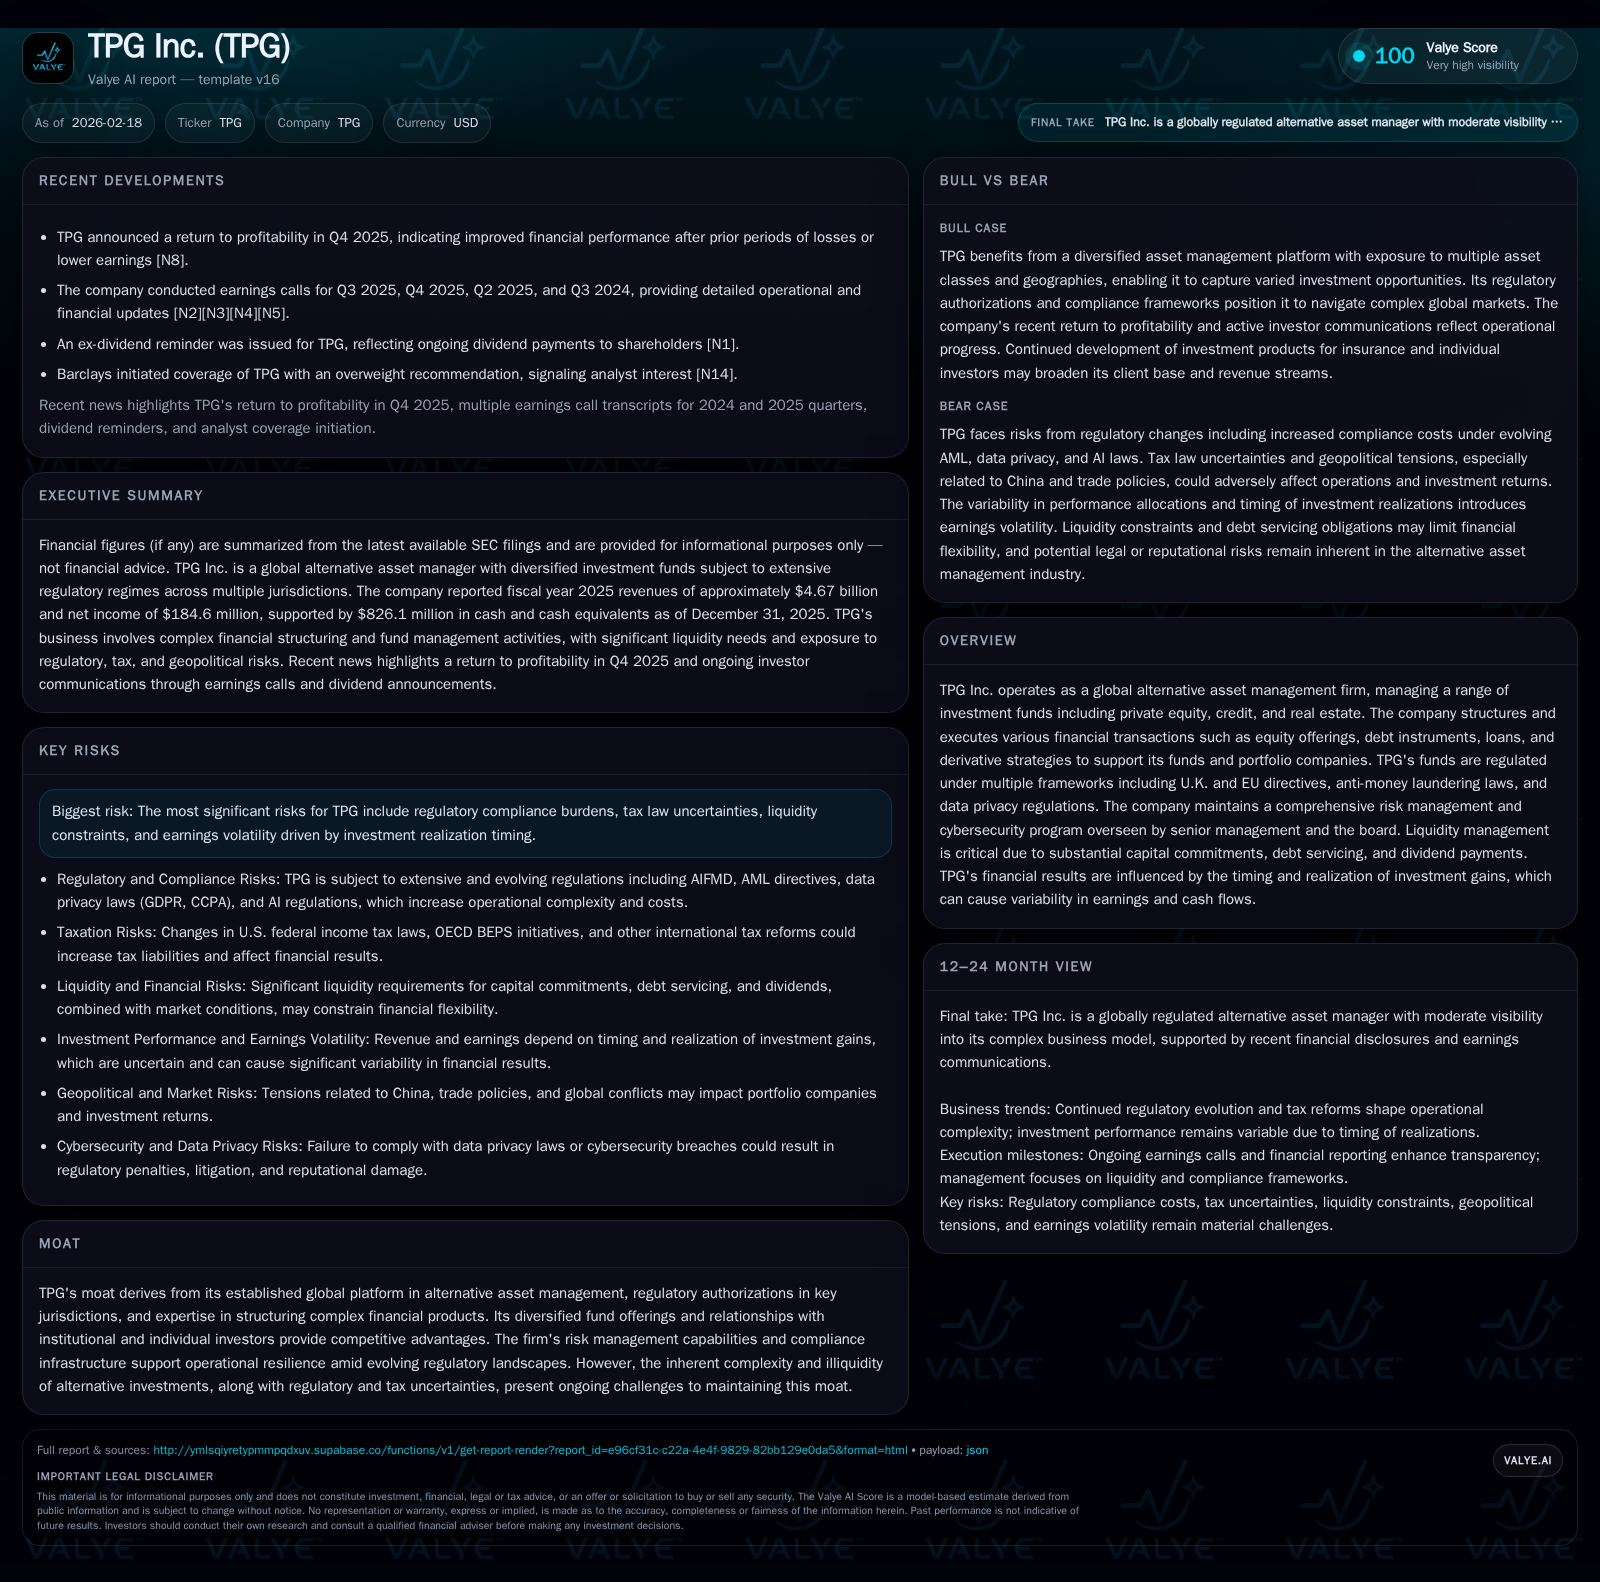
TPG reported strong revenue growth in 2025 driven by expanded assets under management, but faces regulatory complexities and liquidity demands that may influence future performance.
TPG Inc. delivered substantial year-over-year revenue growth of over 30% in 2025, supported by strategic fund launches and acquisitions, alongside broadening its global footprint. However, earnings remain volatile due to the timing of investment realizations and macroeconomic uncertainties. The firm navigates heightened regulatory burdens in the U.K. and EU, particularly with new AIFMD II regulations effective April 2026, while managing significant liquidity requirements related to capital commitments and debt servicing. Capital allocation prioritizes reinvestment into new funds and prudent balance sheet management, yielding a modest ROE reflective of the alternative asset management industry’s cyclical nature.
Past Growth and Historical Performance
TPG Inc. exhibited strong top-line expansion from FY2022 through FY2025. Revenues more than doubled from $2.00 billion in 2022 to $4.67 billion in 2025, representing a compound annual growth rate (CAGR) exceeding 30%:
Historical performance (annual)
| FY | Rev ($bn) | Net ($mm) | CFO ($mm) | Rev YoY | Net YoY |
|---|---|---|---|---|---|
| 2025 | 4.7 | 185 | 1032 | +33.4% | +686.0% |
| 2024 | 3.5 | 23 | 532 | +46.5% | -70.7% |
| 2023 | 2.4 | 80 | 721 | +19.3% | -13.3% |
| 2022 | 2.0 | 92 | 1376 |
Note: Omitted columns lack sufficient annual XBRL coverage in the provided tags (need ≥2 annual points): OpInc, Capex, Div, Buybacks, FCF. Source: SEC companyfacts cache [F1].
Capital returns and efficiency (annual)
| FY | ROE% |
|---|---|
| 2025 | 4.5 |
| 2024 | 0.7 |
| 2023 | 2.4 |
| 2022 | 3.0 |
Source: SEC companyfacts cache [F1].
Note: Operating income, capex, dividends, and buyback data are not available in provided disclosures.
The variability in net income reflects the nature of alternative asset management where earnings are significantly influenced by timing of investment gains realizations and market conditions impacting valuations [N1][N2][S1]. The sizable jump in net income during FY2025 highlights successful exits or mark-ups from portfolio companies as well as improved operational leverage.
Operating cash flow trends corroborate this story; after a dip in mid-period marked by reinvestment cycles or perhaps uneven investment exit activity, CFO rebounded robustly in FY2025 supplying financial flexibility.
Equity consistently increased reflecting retained earnings fueling balance sheet strength.
Future Growth Prospects
TPG’s growth drivers include:
- Continued deployment into private equity, credit, real estate, and special situations funds leveraging Angelo Gordon acquisition synergies [N3][S17].
- Expansion in Europe amidst evolving regulatory frameworks potentially easing over time once compliance infrastructure costs stabilize [S1][S19].
- Introduction of new strategies tapping ESG criteria and niche market segments aligned with emerging investor demand.
Growth ceilings stem from:
- Increased regulatory enforcement creating operational drag notably under AIFMD II regulations effective April 2026 imposing restrictions on open-ended funds and loan-originating vehicles [S1][S19].
- Liquidity pressures given unfunded capital commitments (~$596 million) requiring sizable ongoing cash outlays amid uncertain capital markets environment [S4].
- Talent retention challenges could impair sourcing proprietary deals or maintaining investor confidence if key professionals depart [S1].
Forecasts / Milestones / Expectations
Explicit guidance is limited but watch for:
- Fundraising volumes for European vehicles under AIFMD II compliance costs spreading or diluting net returns.
- Realizations pace influencing quarterly earnings volatility as evidenced through recent earnings calls [N1][N2][N3].
- Progress updates on risk retention for CLOs plus strategic initiatives seeded via available cash flow.[N2][S4]
Close monitoring of macroeconomic variables affecting portfolio valuations will be essential given their outsized influence on reported profits.
Returns / Capital Allocation
With approximate ROE at about 4.5% for FY2025 (net income $185 million over equity base $4.14 billion), TPG demonstrates moderate profitability typical for diversified asset managers balancing fee income versus volatile carried interest earnings [F1].
Operating cash flow generation near $1 billion underscores healthy core cash generation juice capable of supporting significant reinvestment needs.
Dividend payouts or share repurchase activity are not disclosed highlighting a current preference toward scaling assets under management rather than returning capital to shareholders directly—a common stance amid regulatory headwinds requiring robust liquidity buffers [F1][S4].
Capital allocation appears focused on expanding fund vehicles globally while managing debt maturities ($1.72 billion outstanding) balanced against $826 million cash on hand maintaining strong liquidity positions overall [S4][F1].
Regulatory Compliance & Risks
TPG’s operations confront increasing complexity within key jurisdictions:
- U.K.-authorized entities face expanding rules governing larger complex businesses potentially incurring operational restrictions.[S1]
- EU regulations including AIFMD amendments impose higher compliance costs starting April '26 along with substantive limitations specifically on funds "originating loans".[S19]
- AML directives AMLD5/6 increase customer due diligence rigor raising reputational risk should shortcomings emerge.[S19]
- Data protection regimes like GDPR/U.K.’s Data Protection Act impose continued operational burdens alongside emerging AI-related regulation adding novel compliance dimensions.[S27][S10]
These amplify operational expenses while also constraining product design/marketing strategies affecting competitiveness.
Additional risks include significant dependence on senior leadership and investment professionals; loss of these key individuals could materially disrupt fund performance or investor relations.[S1] Litigation exposure exists albeit currently without material pending cases; however potential suits related to securities laws or fund governance remain perpetual considerations.[S12][S16]
Strategic Operational Insights
Post-Angelo Gordon integration introduced segmented information barriers between Credit/Real Estate units from rest of the platform aiming to manage material non-public information risks.[S17] While compliance-driven, these can dampen internal synergy gains blunt tactical leverage over deal flow across divisions.
Broker-dealer activities require net capital maintenance imposing occasional liquidity draws restricting capital redeployment cadence.[S15]
Climate change factors influence portfolio company funding demands especially within real assets where physical climate risk is non-trivial.[S21] International geopolitical tensions elevate trade policy uncertainties possibly impacting foreign portfolio firms depending on supply chain exposure.[S22]
What to Watch Going Forward (Analysis)
Investors should carefully track:
- The pace at which TPG’s European funds adapt to AIFMD II without eroding fee margins materially.
- Realization cycles impacting quarterly earnings volatility foundational to understanding cash flow generation sustainability.
- Debt refinancing costs amid changing credit markets influencing weighted average borrowing cost.
- Senior team stability critical to maintaining access to high-quality deal flow.
- Regulatory changes around cybersecurity/data privacy plus emerging AI usage constraints that may necessitate further operational investments.
Summary Table: TPG Annual Financial Snapshot
| FY | Rev ($B) | Net Income ($M) | CFO ($B) | Equity ($B) | Rev YoY % | Net YoY % | CFO YoY % |
|---|---|---|---|---|---|---|---|
| 2022 | 2.00 | 92 | 1.38 | 3.09 | |||
| 2023 | 2.39 | 80 | 0.72 | 3.36 | +19 | -13 | -48 |
| 2024 | 3.50 | 23 | 0.53 | 3.59 | +47 | -72 | -26 |
| 2025* | 4.67 | 185 | 1.03 | 4.14 | >33 | >686 | >93 |
| *Latest fiscal year ended December; all figures USD; revenue = total fees + other income excluding realized gains details. | |||||||
| Omitted metrics: Operating income, capex, dividends & buybacks due to lack of reported data. |
DISCLAIMER: This analysis is based solely on publicly available information as of February 18, 2026 including SEC filings and news transcripts without any forward-looking statements or investment advice being expressed or implied herewithin.
Disclaimer: This is research-only, informational analysis and not investment advice. It may include AI-generated interpretation and general industry context. Always verify important details using primary sources.
Comments