
Calumet’s Return to Operating Profitability Highlights Specialty Products and Renewable Fuels Synergy
After years of financial distress, Calumet reversed its operational losses in 2025, driven by its diversified specialty product lines and expansion in renewable fuels, alongside disciplined capital management.
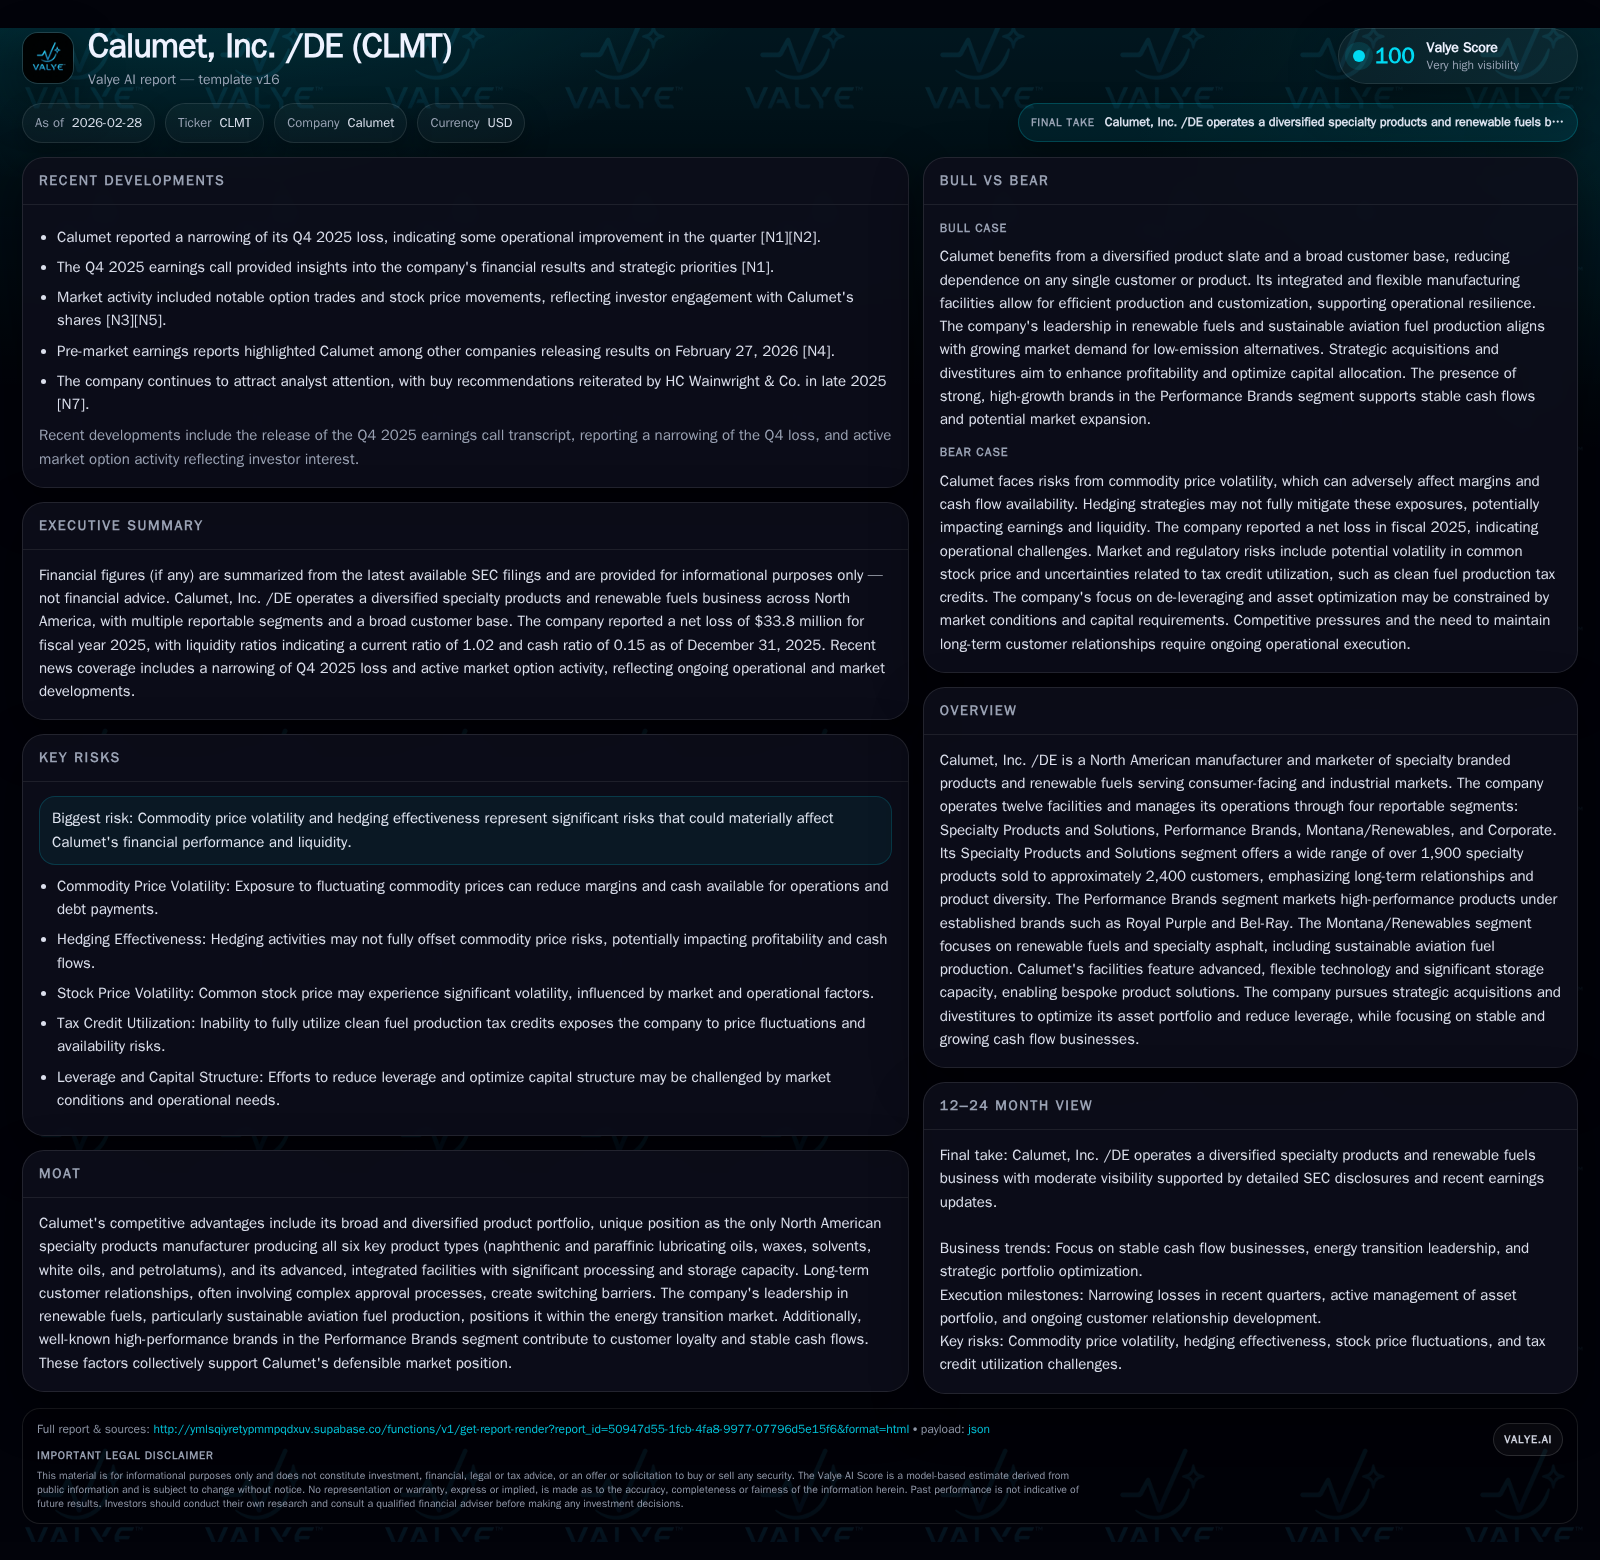
Calumet, Inc. /DE achieved a remarkable operating income rebound in fiscal year 2025, surging over twelvefold to $108.7 million from a modest $8.1 million in 2024, while narrowing its net loss significantly. This turnaround was anchored in the strength of its Specialty Products and Solutions segment’s extensive portfolio and customer loyalty, coupled with robust performance in its Montana Renewables segment centered on sustainable aviation fuel production. Improved cash flow generation and targeted capex reductions further underpin operational resilience amidst ongoing debt maturities and commodity price volatilities.
Financial Turnaround in 2025: Analyzing the Operating Income Surge
Historical performance (annual)
| FY | Net ($mm) | CFO ($mm) | OpInc ($mm) | Capex ($mm) | Net YoY |
|---|---|---|---|---|---|
| 2025 | -34 | 109 | 109 | 52 | +84.8% |
| 2024 | -222 | -46 | 8 | 77 |
Source: SEC companyfacts cache [F1].
Capital returns and efficiency (annual)
| FY | FCF ($mm) | ROE% |
|---|---|---|
| 2025 | 57 | 4.6 |
| 2024 | -123 | 31.2 |
Source: SEC companyfacts cache [F1].
Calumet delivered a striking financial reversal in calendar year 2025, boasting an operating income of $108.7 million — a twelvefold increase versus the prior year's $8.1 million [F1]. Despite the bottom line still showing a net loss of $33.8 million compared to a steep $222 million loss in 2024 [F1], this marked an improvement of nearly 85%. The scale of earnings rebound is unusual within specialty chemicals and renewables sectors where cyclical pressures often temper profitability swings.
This operating income surge is underpinned by enhanced operational efficiencies and favorable segment contributions disclosed in the company’s MD&A [S1]. Notably, the corporate overhead remained controlled even amid rising raw material costs suggesting disciplined expense management.
Specialty Products Breadth Fuels Customer Loyalty and Sales Stability
A core driver behind this turnaround owes to Calumet's Specialty Products and Solutions segment which commands approximately 40.6% of continuing operations gross profit [S7]. This segment markets an impressive suite exceeding 1,900 specialty products sold primarily as raw materials for consumer-facing and industrial customers [S4]. Serving roughly 2,400 customers annually [S4], Calumet benefits from significant switching costs embedded in long lead times for product certification and replacement.
Among its competitive moats is the unique North American footprint producing all six key product types: naphthenic/paraffinic lubricating oils, waxes, solvents, white oils, petrolatums – offering versatile shipping options across integrated facilities [S21]. Such breadth affords the company flexibility to cross-utilize feedstocks within its processing units enabling cost-advantaged product upgrades tailored to specific customer needs.
This diversity insulates Calumet somewhat from pure commodity price impacts; incremental feedstock costs are typically passed through to customers preserving margin resilience [S7].
Renewables Driving Growth: The Montana Segment’s Role in Market Recovery
Calumet’s Montana/Renewables segment emerged as a powerhouse accounting for around 83.6% of continuing operations gross profit in fiscal 2025 [S7]. Anchored by advanced renewable fuel processing capabilities at MRL facility, it converts diverse geographically advantaged feedstocks into renewable diesel, sustainable aviation fuel (SAF), and renewable naphtha distributed across western North America [S4][S21].
The facility's permitted capacity stands at about 15,000 barrels per stream day — positioning it as one of the largest SAF producers on the continent [S21]. This leadership leverages growing clean energy mandates fueling demand for low carbon intensity fuels amid energy transition policies.
Operational enhancements including throughput improvements and asset reliability investments during the year contributed materially to improved cash flows [S7]. Management indicated ongoing plans for expansion projects aimed at scaling output further [N1][S7].
Operating Cash Flow Rebound and Capex Discipline: Managing Growth and Efficiency
Operational improvements reverberated positively into cash generation metrics. Calumet swung from negative operating cash flow of -$46.4 million in 2024 to a robust positive $108.9 million in 2025 — a rise exceeding +335% year-over-year [F1]. Capital expenditures substantially moderated by nearly one-third from $76.7 million down to $52.3 million during the same period [F1], marking a disciplined approach toward balancing growth with capital efficiency.
The resultant free cash flow approached $56.6 million (CFO less capex) providing critical liquidity comfort amid debt service obligations [F1]. The firm continues optimizing existing asset utilization via operational modernizations focused on logistics efficiencies and improving specialty product yields without aggressive capital outlays [S7].
Capital Structure and Liquidity Dynamics Amid Debt Maturity Profiles
Calumet confronts a challenging capital structure characterized by considerable debt maturing between 2026 and 2029 including notes carrying fixed interest rates around ~8-11% [S5][S6][S8]. Cash & equivalents totaled $125.1 million against current liabilities near $840.7 million giving a current ratio barely above parity at approximately 1.02 as of end-2025 [F1].
Equity remains deeply negative at -$732.7 million but marginally improved over prior year’s -$711.9 million reflecting accumulated retained losses despite earnings gains [F1]. Management explicitly focuses on deleveraging measuredly while preserving access to revolving credit facilities that support working capital needs and growth investments [S5][N1].
Recent disclosures indicate continued asset portfolio optimization including potential non-core divestitures paired with selective low-risk acquisitions aimed at deepening specialty product offerings with accretive economics [N1][S19].
Strategic Outlook and Growth Opportunities: What to Watch Next
While explicit forecasts remain pending [N1], several avenues emerge analytically for Calumet’s future expansion prospects:
- Incremental growth through further specialization within its vast formulation catalog targeting larger OEMs’ evolving specifications leveraging proprietary wet-processing techniques underpinned by long client development cycles [S4][N1]
- Scaling Montana Renewables production capacity adjacent to anticipated regulatory tailwinds favoring SAF mandates potentially enhancing premium realizations relative to fossil jet fuels [S21][N1]
- Prudent capital redeployment from non-core divestitures into projects enhancing throughput or cost positions within existing complexes corroborating margin expansion themes [N1][S7]
- Continued discipline on operational expense fronts limiting overhead inflation amid volatile input prices
Collectively these points form an ecosystem supporting sustained earnings recovery provided market conditions stabilize adequately.
Risks from Commodities Volatility and Hedging Effectiveness
Calumet explicitly recognizes commodity price volatility—especially linked to crude oil feedstock costs—as a paramount risk factor influencing both top-line results and margin sustainability [S10]. The firm’s ability to pass incremental feedstock cost changes onto specialty customers buffers some risk but imperfectly shields against rapid market dislocations affecting working capital cycles.
Moreover, hedging strategies aimed at mitigating exposure have inherent effectiveness limitations given basis risks between commodity derivatives instruments versus physical pricing indices impacting realized outcomes [N1][S10]. For an operator balancing specialty chemical margins with commodity feedstocks this dynamic consistently challenges earnings predictability.
Liquidity could be pressured if hedges fail during adverse price swings requiring increased collateral or drawing more heavily on revolvers which bear interest cost implications.[S10]
Evaluating Returns: ROE, Dividends, and Free Cash Flow Generation
Calumet’s return on equity improved considerably manifesting roughly 4.6% when comparing net income against negative equity balances for fiscal year ended December 31, 2025 despite still reporting net losses (-$33.8M net loss; -$732.7M equity) where negative denominator exaggerates metric magnitude but directionally confirms improving profitability trends [F1].
No dividends or share buybacks were disclosed consistent with ongoing capital preservation priorities amid financial restructuring efforts [N1]. The significant free cash flow generation post-capital investment highlights potential for future distribution capacity once balance sheet strength solidifies further.[F1]
This report synthesizes publicly available company filings and earnings call disclosures without providing investment recommendations or price targets. Financial data have been cited directly without extrapolation beyond reported periods.
Disclaimer: This is research-only, informational analysis and not investment advice. It may include AI-generated interpretation and general industry context. Always verify important details using primary sources.
Comments