
CME Group’s Evolving Market Footprint: New Products and Tech Infrastructure in Q1 2026
Q1 2026 results spotlight CME’s advancing product suite and robust liquidity amid rising volumes and expanded trading hours.
CME Group’s Q1 2026 filing reveals increasing average daily volumes across core asset classes supported by new product rollouts, including planned 24/7 crypto trading. The company maintains a strong liquidity position with zero net debt and solid cash reserves. Its diversified business model spans clearing, transaction fees, and market data, underpinned by leading electronic platforms and clearing infrastructure. Regulatory milestones such as SEC approval for securities clearing and strategic expansions in treasury and crypto derivatives position CME well for sustainable growth despite regulatory and technology risks.
Q1 2026 Operating Update Highlights
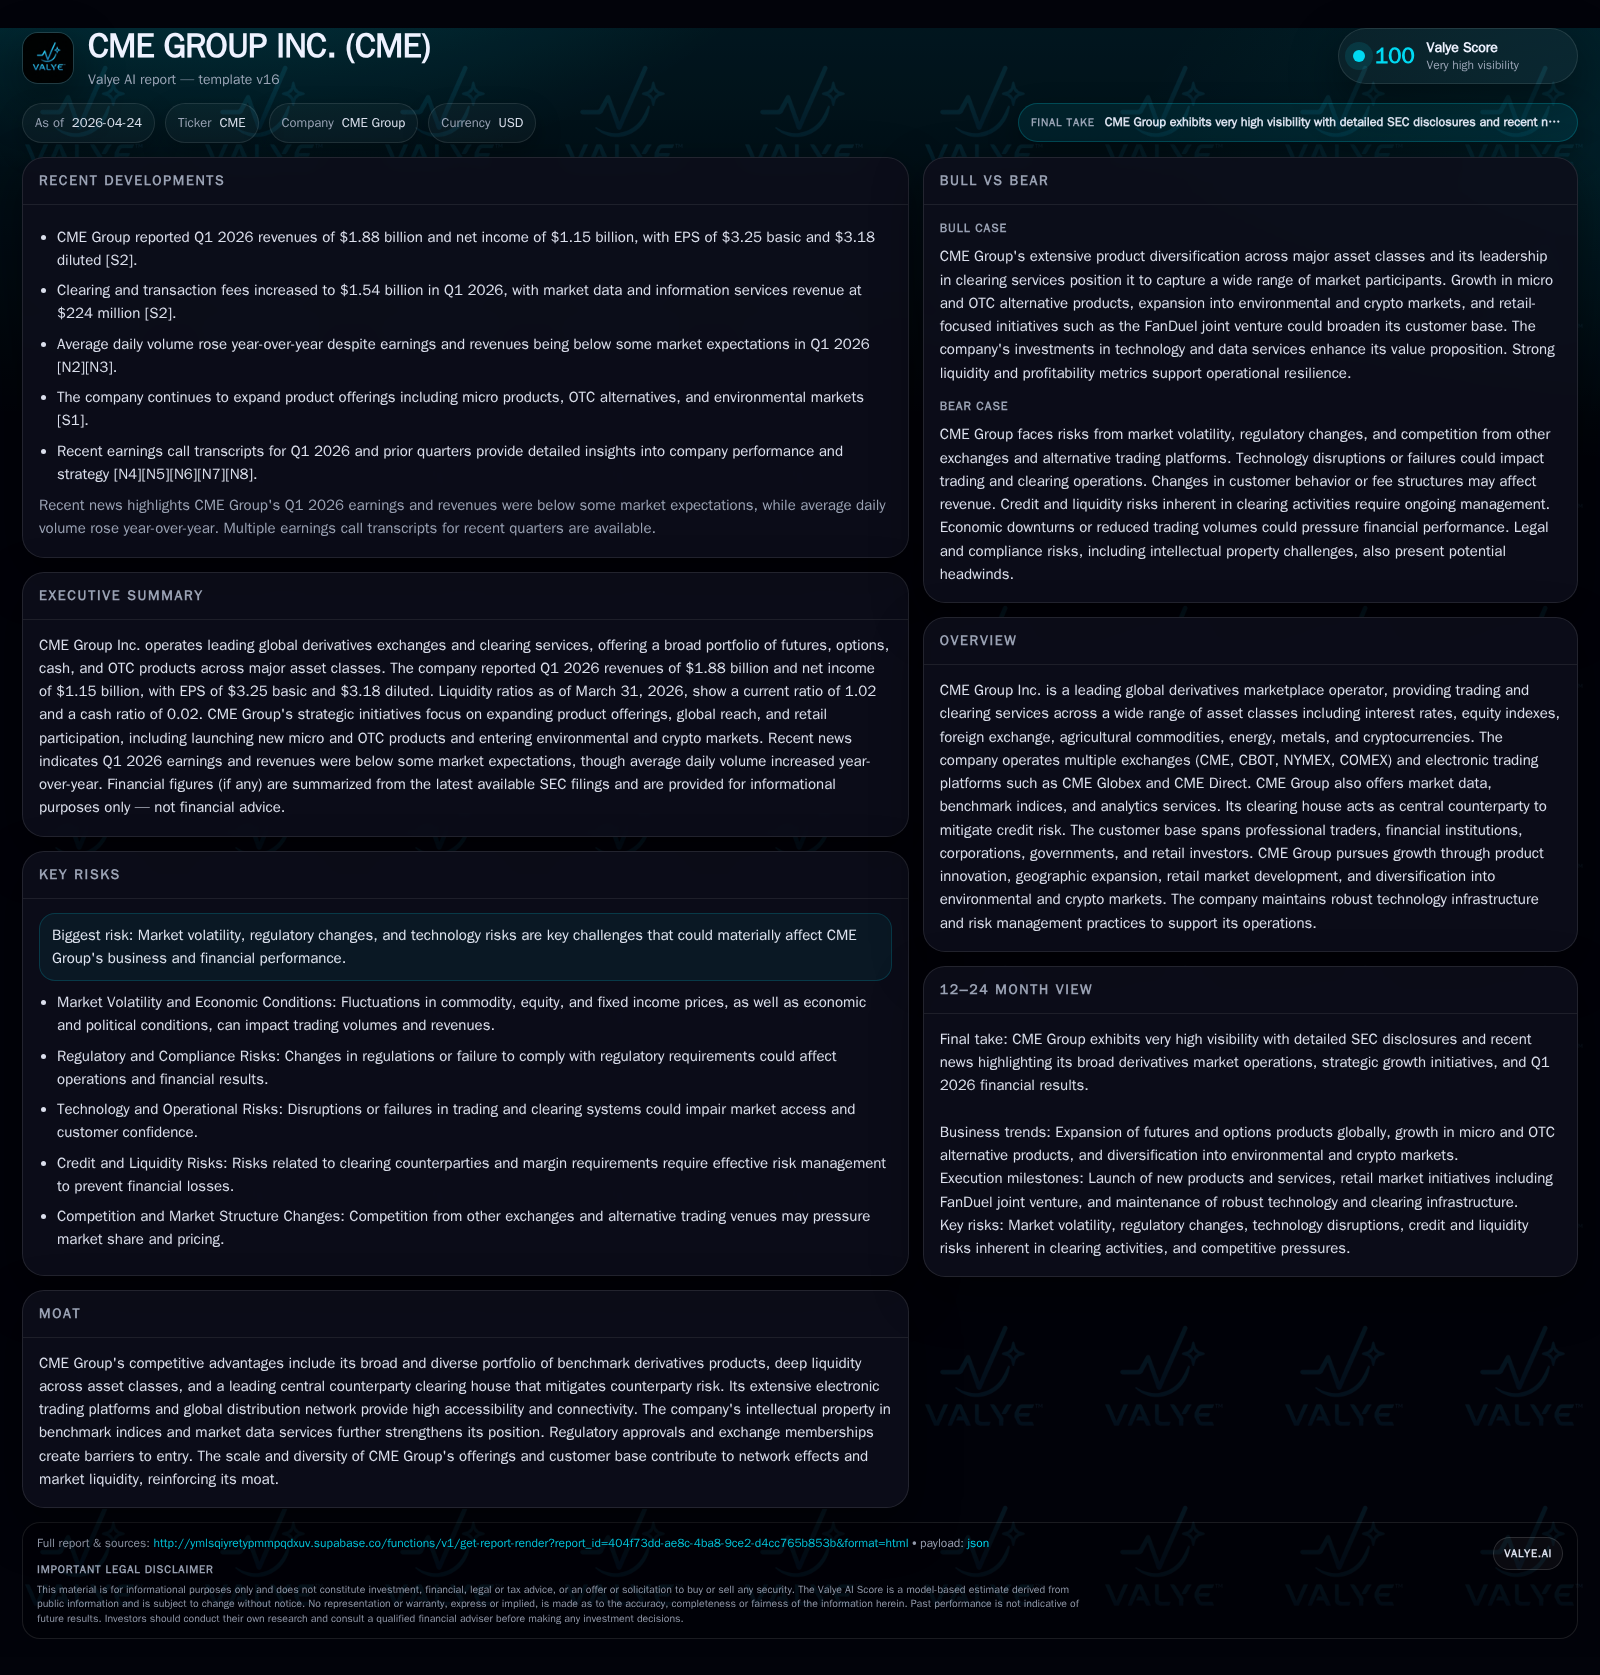
CME Group's Q1 2026 results (filing dated April 24, 2026) showcase solid underlying momentum despite some analyst estimate misses reported externally [N2,N3]. The company reported net income of $1.15 billion for the quarter, up materially from $956 million year-over-year [S2]. Key volume metrics showed improvement across several franchises with notable ADV growth supporting clearing and transaction fee revenue increase.
A standout development is the planned rollout in Q2 of continuous 24/7 trading for its entire crypto derivatives suite. This move addresses growing client demand for hedging strategies that align with the always-on nature of cryptocurrency cash markets over weekends [S1]. Other recent product innovations include expansions into credit instruments, Treasury bills, and TBA (To-Be-Announced) mortgage futures—further diversifying CME's derivatives offerings [S1,S3].
The clearing house function continues to act as central counterparty across asset classes. Its risk management remains foundational to settling increased open interest reliably, supporting client confidence during periods of volatility. CME also reported growth in its market data fee business—a vital stable subscription stream—fueled by enhanced analytic tools offered natively on Google Cloud infrastructure [S2,S16].
Business Model Nuances: Clearing, Trading Fees, and Market Data
CME Group's economic engine primarily derives from transaction-based clearing fees plus comprehensive market data licensing services [S6,S16]. Clearing fees are charged on per-contract basis with tiered rate sensitivity depending on member status and product mix [S9]. As clearings represent trades executed through exchanges like CME Globex targeting futures/options clients globally, volume trends directly influence revenue.
The central counterparty clearing (CCP) role not only mitigates credit risk but embeds CME into customers' workflow—creating switching costs via operational integration, margin tools like SPAN portfolio margining, and cross-margining agreements with other clearinghouses such as FICC enhancing capital efficiency [S10,S21]. This positions CME uniquely compared to alternative execution venues lacking equivalent clearing capabilities.
Market data leverages CME's intellectual property ownership of benchmark indices (e.g., S&P-linked futures via joint venture licenses) providing recurring subscription income streams less cyclical than trading revenues. Offering live cloud-based data feeds furthers adoption especially among algorithmic traders demanding resilient low-latency connections [S16].
Market Structure Dynamics and Competitive Moat Analysis
Within global derivatives exchanges, CME holds a commanding market share spanning interest rates, equity indices, FX, commodities, and cryptocurrencies—facilitated by an extensive portfolio of brands (CME, CBOT, NYMEX, COMEX). Deep liquidity pools produce network effects; larger participant bases attract more volume creating a virtuous cycle that is difficult for competitors to replicate.
Barriers to entry are supported by stringent regulatory approvals needed to operate derivatives exchanges or CCPs in key jurisdictions like the U.S. SEC recognition of subsidiaries (such as CME Securities Clearing Inc. becoming a registered clearing agency late 2025) further consolidates this defensible position [S1,S21].
Customers span institutional traders to retail brokers—aided by trade access rights protected under exchange membership systems granting preferential fee structures or execution options [S5]. High-speed telecom hubs enable global connectivity while robust disaster recovery plans ensure platform resilience critical for continuous operation.
The clearing house acts as a linchpin in the market’s risk architecture—absorbing counterparty risk exposure—which is a substantial moat element harder to replicate than pure order-book liquidity or marketplace branding alone.
Drivers Behind Trading Volume Growth and Product Expansion
Historical trends show FMC’s options segment posting rapid ADV growth backed by micro-sized contracts introduced across major asset classes—lowering barriers for smaller or retail participants seeking targeted hedge granularities [S14,S16]. This diversification allows CME to broaden customer adoption beyond large institutional players.
Emerging product lines such as Treasury bills futures build atop dominant U.S. Treasury note/bond futures foundations and extend addressable markets to fixed income investors seeking intraday or short-duration risk management tools [S14]. Mortgage-related TBA futures augment fixed income solutions catering to mortgage originators or investors managing pipeline risk.
Cryptocurrency derivatives remain a focal point for expansion given their nontraditional trading hours; launching true continuous weekend sessions aligns product offerings with the underlying asset market hours—a structural shift anticipated to increase sustained volume capture from digital asset ecosystem participants starting Q2 2026 [S1,S3].
Technology backbone advancements including the transition to Google Cloud facilitate scalability accommodating surges in order flows while maintaining platform reliability—a prerequisite for attracting algorithmic trading firms dependent on uninterrupted access [S16,S25].
Constraints: Regulatory Headwinds, Market Volatility Risks, and Technology Dependence
Despite growth avenues, CME faces complex challenges stemming from heightened regulatory scrutiny requiring ongoing investments in compliance infrastructure—e.g., SEC-cleared agency mandates drive operational resource allocation potentially impacting margins short term [S25,S4]. Regulatory changes influencing allowable products or pricing models create uncertainty about future fee levels.
Market volatility presents a dual-edged sword: while periods of high volatility can spike volume (and thus revenues), calmer environments typically suppress activity reducing transaction fees—a cyclical factor that requires careful expense management considering fixed-cost characteristics of exchange operations [S15].
Dependence on third-party technology providers introduces vendor risk including performance outages or cybersecurity threats affecting client trust if not mitigated effectively by internal risk controls. Investments in proprietary intellectual property protections are critical but costly endeavors ensuring competitive positioning against alternative platforms or emerging fintech entrants encroaching on traditional exchange value propositions [S7,S25].
Customer concentration also poses monitoring needs despite experience indicating market share transfers across clearing firms if a major participant withdraws; yet persistent concentration metrics warrant vigilance due to potential systemic exposure implications especially amidst industry consolidation trends [S5,S26].
Near-Term Catalysts to Monitor: Crypto Trading Hours and Treasury Suite Developments
Upcoming implementation of full weekend crypto trading represents an important catalyst signaling CME’s commitment to evolving market demands around digital assets—expected to enhance trading continuity option-demand capture compared to legacy schedules limited to weekday sessions only. This initiative may set new competitive standards with other derivatives venues also eyeing expanded crypto derivatives accessibility postures [S1,S3].
Further extensions into credit instruments via newly launched futures products along with broadening Treasury bills/Mortgage TBA offerings diversify earnings streams away from equity index dependencies while appealing to fixed income desks transitioning amid macroeconomic adjustments. These additions improve hedging precision capabilities for clients confronting multi-faceted risk exposures across duration curves or credit quality spectrums [S14].
Monitoring adoption rates within these niches alongside expanding retail investor penetration through partnerships (e.g., FanDuel prediction market app integrating simplified event contracts launched December 2025) will provide critical insights into execution effectiveness of growth strategies targeting both institutional scale users and mass-market audiences simultaneously [S11].
Financial Profile: Profitability, Liquidity, and Capital Allocation
Historical performance (annual)
|
| FY | Rev ($bn) | Net ($bn) | CFO ($bn) | OpInc ($bn) | Rev YoY | Net YoY |
|---|---|---|---|---|---|---|
| 2025 | 6.5 | 4.1 | 4.3 | 4.2 | +6.4% | +15.5% |
| 2024 | 6.1 | 3.5 | 3.7 | 3.9 | +9.9% | +9.3% |
| 2023 | 5.6 | 3.2 | 3.5 | 3.4 | +11.1% | +19.9% |
| 2022 | 5.0 | 2.7 | 3.1 | 3.0 |
Source: SEC companyfacts cache [F1].
Capital returns and efficiency (annual)
|
| FY | Div ($bn) | FCF ($bn) | ROE% |
|---|---|---|---|
| 2025 | 3.9 | 4.2 | 14.2 |
| 2024 | 3.6 | 3.6 | 13.3 |
| 2023 | 3.2 | 3.4 | 12.1 |
| 2022 | 2.6 | 3.0 | 10.0 |
Source: SEC companyfacts cache [F1].
CME’s first quarter financials affirm resilient profitability with net income climbing approximately 20% year-over-year to $1.15 billion (from $956 million prior year quarter) reflecting favorable volume trends blending with disciplined cost controls evident in stable amortization/depreciation lines noted in disclosures [S2,F1]. Operating cash flow trends remain strong evidenced by prior annual CFO increases supporting capital expenditure moderation ($83.5 million capex FY2025 down ~11% YoY) reaffirming operational leverage inherent in business model economics [F1].
Dividend payments have incrementally increased alongside earnings growth (~$3.93 billion dividends paid FY2025), illustrating commitment toward shareholder returns within capital recycling frameworks balancing organic investment needs versus distributions over time [F1]. Sustained negative net debt coupled with robust free cash flow generation underpin flexibility whether directed toward opportunistic acquisitions or further innovations facilitating long-run competitive differentiation.
This analysis synthesizes public filings without offering investment advice or recommendations and relies exclusively on cited sources.
Disclaimer: This is research-only, informational analysis and not investment advice. It may include AI-generated interpretation and general industry context. Always verify important details using primary sources.
Comments