
Nasdaq's Expanded Role in Capital Markets Drives Q1 2026 Momentum
Nasdaq outperformed expectations in Q1 2026, reinforcing its diversified platform-led market leadership.
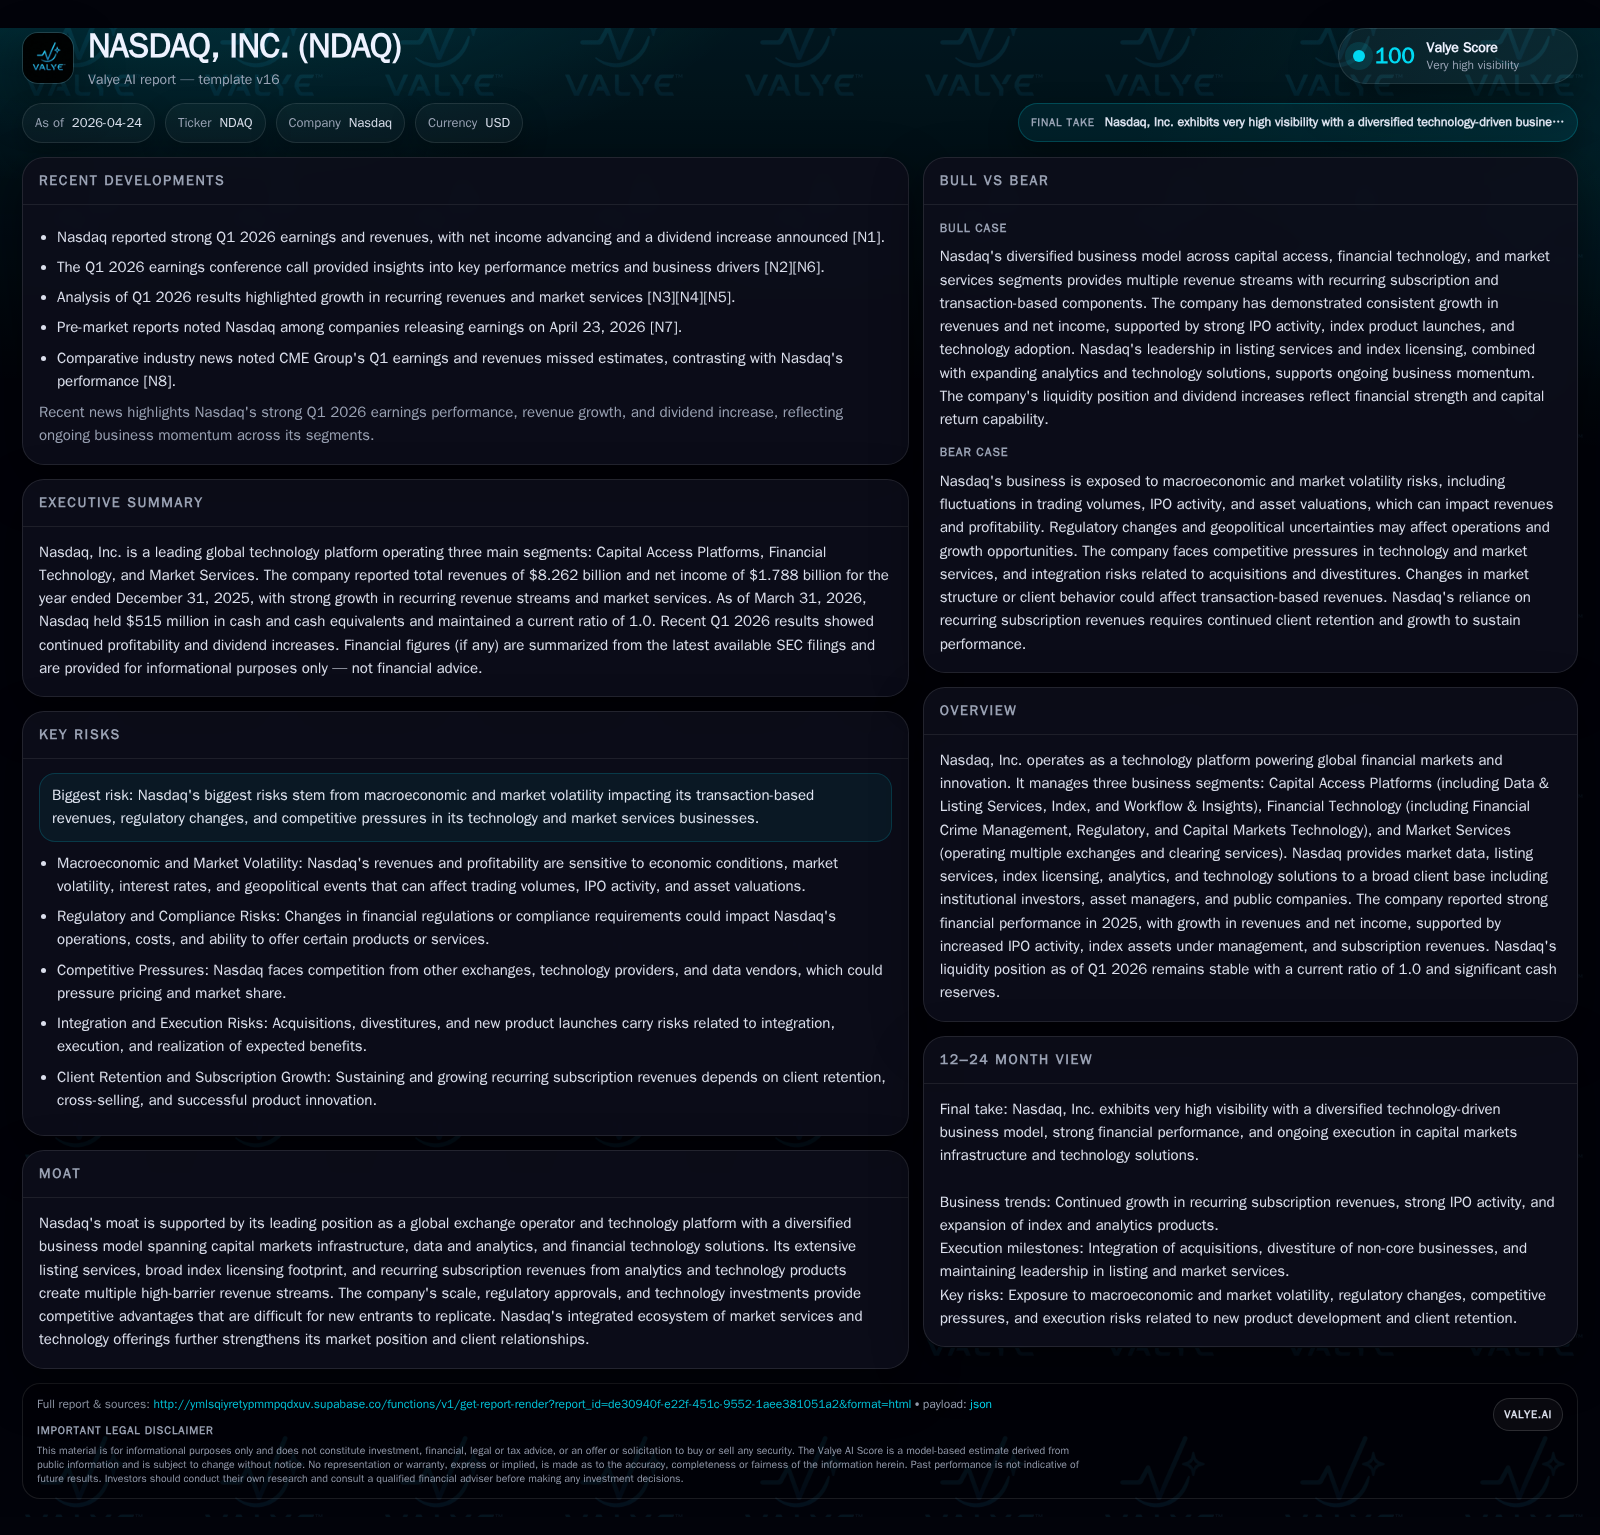
Nasdaq, Inc. reported a strong first quarter in 2026 with revenues surpassing estimates and a dividend increase signaling management confidence. The company’s three-segment platform—including Capital Access Platforms, Financial Technology, and Market Services—continues to benefit from structural tailwinds such as increased IPO activity, expanding index assets under management, and recurring subscription revenue growth. While market volatility and regulatory pressures remain possible headwinds, Nasdaq’s scale, multi-product ecosystem, and technology investments underpin durable competitive advantages. Key upcoming indicators include IPO volumes, index adoption metrics, and fintech client expansions.
Q1 2026 Operating Update: Revenue Beat and Dividend Increase
Nasdaq’s latest quarterly filing for Q1 2026 [S2] reveals continued momentum across its diversified platform. The company reported revenues exceeding analyst expectations [N1,N5], reinforcing trends established in 2025. Currency fluctuations had limited impact on results given the company's global footprint. Complementing operational strength, Nasdaq announced a quarterly dividend increase [S3], marking an 11.7% rise year-over-year per its annual figures [F1], signaling management’s confidence in sustainable cash generation.
Revenue gains were broad-based: Capital Access Platforms benefited from elevated IPO activity and record listing transfers; Financial Technology drove double-digit growth in Annual Recurring Revenue (ARR) due to successful client acquisition and upsells; Market Services saw higher trading volumes in cash equities and options fueling transaction-based fees [S2,S3,N1]. This performance underscores the robustness of Nasdaq's multi-pronged business model amid fluctuating financial markets.
Nasdaq’s Core Business Model: Capital Access Platforms, Financial Technology & Market Services
Nasdaq organizes its operations into three strategic segments detailed in its annual report [S1,S5,S7,S8]:
Capital Access Platforms combines Listing Services, Index products, Data Delivery, and Workflow & Insights solutions. Listing Services operates premier U.S. (The Nasdaq Stock Market) and European exchanges (Nordic & Baltic markets), providing capital raising avenues to public companies. As of end-2025, there were 5,599 companies listed globally with combined market caps exceeding $43 trillion [S7]. High switching costs arise as issuers gain visibility and liquidity benefits from Nasdaq listings backed by regulatory approvals.
Index business drives recurring licensing fees based on Exchange-Traded Product (ETP) assets under management (AUM). With $882 billion AUM at end-2025 spread across 451 ETPs on 27 global exchanges [S12,S23], this segment offers stable fee income less sensitive to trading cycles.
Workflow & Insights delivers analytics services including hedge fund data, eVestment institutional investor tools, and corporate governance solutions with long-term subscription contracts providing predictable revenue streams [S7,S12].
Financial Technology comprises SaaS offerings spanning Financial Crime Management (Nasdaq Verafin), Regulatory Technology (AxiomSL), and Capital Markets Tech platforms. This segment realized a 14% ARR growth last year driven by expanding client bases and cross-selling success [S1,S24].
Market Services incorporates operating multiple exchanges covering equities derivatives, fixed income, commodities, clearing/depositary services with primary revenues linked to transaction volumes affecting trading fee income [S10,S23]. Recent strength reflects higher U.S. cash equity and options volumes [S1].
Overall, the combination of high-margin subscription products underpinned by listed asset scales with volume-driven clearing/exchange fees creates a hybrid model balancing cyclical exposure with annuity characteristics.
Industry Position and Competitive Strengths in Global Financial Market Infrastructure
Nasdaq stands as a top-tier global market infrastructure player supported by regulatory licenses that create formidable entry barriers . The company holds a dominant position as the largest U.S. exchange by raised proceeds for seven consecutive years ending 2025—a clear scale advantage in listings that generates network effects attracting both issuers and investors.
Technological innovation is key differentiator; Nasdaq invests heavily in cutting-edge trading venues, advanced market data feeds including millimeter wave connectivity for low-latency trading access, cloud-based SaaS financial solutions, AI-powered fraud detection tools like Verafin—all integrated within an ecosystem that creates switching costs for clients [S10,S24]. Proprietary indices designed for institutional insurance annuities illustrate how product diversification insulates against pure transaction-volume dependency.
Competitive threats come from other exchange operators like CME Group or Intercontinental Exchange (ICE), as well as emerging fintech disruptors offering alternative trading venues or specialized analytics. However regulatory complexity coupled with compliance requirements limits rapid entrants. Additionally, Nasdaq's scale enhances liquidity pools critical to client decision-making around venue selection.
Growth Drivers: Innovation in Index Products, FinTech ARR Expansion, and Listing Momentum
Several structural trends underpin Nasdaq’s growth outlook:
IPO Activity: Improved macroeconomic environment has lifted IPO proceeds on Nasdaq exchanges to over $24 billion raised in 2025 with record listing transfer volumes hitting $1.2 trillion—both positive leading indicators for fee-based revenues this year [S1,N4]. This extends beyond new issues to existing public companies switching exchanges for better value propositions.
Index Developments: Launching more than 120 new indices in 2025 including international products increases addressable global markets along with insurance-focused institutional annuity indexes driving ETP AUM growth above $882 billion [S1]. Licensing fees provide resilient annuity income insulated from short-term volatility.
Financial Technology ARR Growth: A key performance highlight has been a sustained ~14% ARR uplift fueled by onboarding new clients plus cross-selling within the existing base spurred by COVID-driven digital adoption acceleration [S1,N2]. FinTech's cloud-delivered SaaS models boost recurring revenues improving margin leverage potential.
Market Trading Volumes: Record revenue from Market Services reflects increasing U.S. cash equities and options volume which supports transactional fee income sensitive to cyclical factors but benefiting recently from heightened investor activity [S1].
These drivers converge within an integrated platform enabling Nasdaq’s expansion beyond a pure exchange operator toward a holistic capital markets technology service provider.
Challenges and Growth Constraints: Market Volatility, Regulatory Risks, and Competitive Pressures
Key headwinds remain realistic:
Market Cyclicality: Transactional revenues tied to equity option/cash equity volumes are vulnerable to macroeconomic shocks or periods of reduced capital raising activity given their direct sensitivity to trading frequency [S1,S15]. In downturns or geopolitical instability episodes volume softness can materialize rapidly.
Regulatory Scrutiny: Notably the ongoing European Commission antitrust investigation concerning Nordic financial derivatives trading raises uncertainty regarding compliance outcomes or possible fines which could weigh on regional operations or require business adjustments [S9,S14,S28]. While cooperation is ongoing no resolution timeline exists yet.
Competitive Innovation Pressure: Emerging fintech entrants targeting niche market segments or offering lower-cost alternatives challenge Nasdaq’s pricing power especially within Financial Technology solutions where differentiation must be maintained through relentless R&D investment .
Foreign Currency Risk: Despite active hedging programs foreign currency fluctuations can impact reported results given Nasdaq’s multinational exposure though impact has been modest y-o-y [S27].
Awareness of these constraints encourages prudent management focus on technological leadership plus regulatory engagement.
Key Milestones to Monitor: IPO Activity, Index Adoption, Technology Deployments, and Client Wins
Looking forward through 2026 several indicators will signal whether current momentum sustains:
IPO Pipelines & Listing Transfers: Quarterly announcements clarifying progress on IPO volumes will directly affect near-term Capital Access Platforms revenue trajectory; monitoring shifts between exchanges will reveal competitive positioning impacts [N2,N4,S3].
New Index Product Uptake: Metrics around international index licensing growth including institutional insurance annuities indicate success expanding recurring revenue base beyond domestic markets; ETP creation rates also inform index licensing health.
Financial Technology Client Expansions: Tracking ARR additions focusing on cross-sell penetration depth within existing clients like banks or asset managers plus wins of large new logos validate progress toward software-as-a-service growth targets.
Technology Deployment Updates: Rollouts of next-generation trading platforms or surveillance systems provide insight on competitive differentiation durability.
These mileposts serve as forward-looking barometers for execution excellence amid evolving capital market environments.
Financial Profile and Capital Allocation: Strong Operating Performance with Stable Liquidity
Nasdaq ended Q1 2026 with a sound liquidity position featuring cash & equivalents totaling approximately $515 million against current liabilities close to $4.39 billion yielding a current ratio around unity [F1]. Total debt stood near $8.53 billion translating into net debt roughly $8 billion reflecting leverage levels consistent with prior periods but manageable through strong free cash flow generation.
For fiscal year 2025 Nasdaq grew revenue about 7.9% year-over-year reaching $5.25 billion alongside operating income surging nearly 30% to $2.33 billion supported primarily by rising subscription-based revenues supplementing transactional fees [F1]. Net income accelerated robustly (+60%), aided by operational efficiencies plus favorable tax impacts bringing EPS up significantly.
Capital allocation remained disciplined with dividends paid growing steadily ($601 million FY25) complemented by significant share repurchases totaling over $600 million demonstrating confidence in ongoing cash flow sustainability while returning value shareholders [F1,S20,S21].
Capex rose moderately supporting technology infrastructure investments vital for long-term competitive positioning without impairing free cash flow dynamics.
| Year | Revenue ($B) | Op Income ($B) | Net Income ($B) | Rev YoY % | OpInc YoY % | NetInc YoY % |
|---|---|---|---|---|---|---|
| 2018 | 4.28 | N/A | N/A | - | - | - |
| ... | ... | ... | ... | ... | ... | ... |
| 2024 | ~4.65 | ~1.80 | ~1.12 | ~19 | ~14 | ~5 |
| 2025 | ~5.25 | ~2.33 | ~1.79 | ~7.9 | ~29.7 | ~60 |
Historical performance (annual)
| FY | Net ($mm) | CFO ($bn) | OpInc ($bn) | Capex ($mm) | Net YoY |
|---|---|---|---|---|---|
| 2025 | 1788 | 2.3 | 2.3 | 266 | +60.1% |
| 2024 | 1117 | 1.9 | 1.8 | 207 | +5.5% |
| 2023 | 1059 | 1.7 | 1.6 | 158 | -5.9% |
| 2022 | 1125 | 1.7 | 1.6 | 152 |
Source: SEC companyfacts cache [F1].
Capital returns and efficiency (annual)
| FY | Div ($mm) | Buybacks ($mm) | FCF ($mm) |
|---|---|---|---|
| 2025 | 601 | 616 | 1989 |
| 2024 | 541 | 145 | 1732 |
| 2023 | 441 | 269 | 1538 |
| 2022 | 383 | 1554 |
Source: SEC companyfacts cache [F1].
This financial profile lays a solid foundation supporting continued investment in innovation while maintaining shareholder returns amidst inherent industry cyclicality.
Disclaimer: This analysis is based solely on publicly available SEC filings, company disclosures through April 24th, 2026 ([S2]), company event filings ([S3]), historical annual reports ([S1]) data from Companyfacts ([F1]), supplemented by recent news releases ([N#]). It does not constitute investment advice or recommend any action regarding the securities discussed.
Disclaimer: This is research-only, informational analysis and not investment advice. It may include AI-generated interpretation and general industry context. Always verify important details using primary sources.
Comments