
M/I Homes Advances Through Pricing Pressures and Market Headwinds
Latest quarterly results show margin contraction amid housing demand softness, while diversified operations and integrated finance services offer resilience.
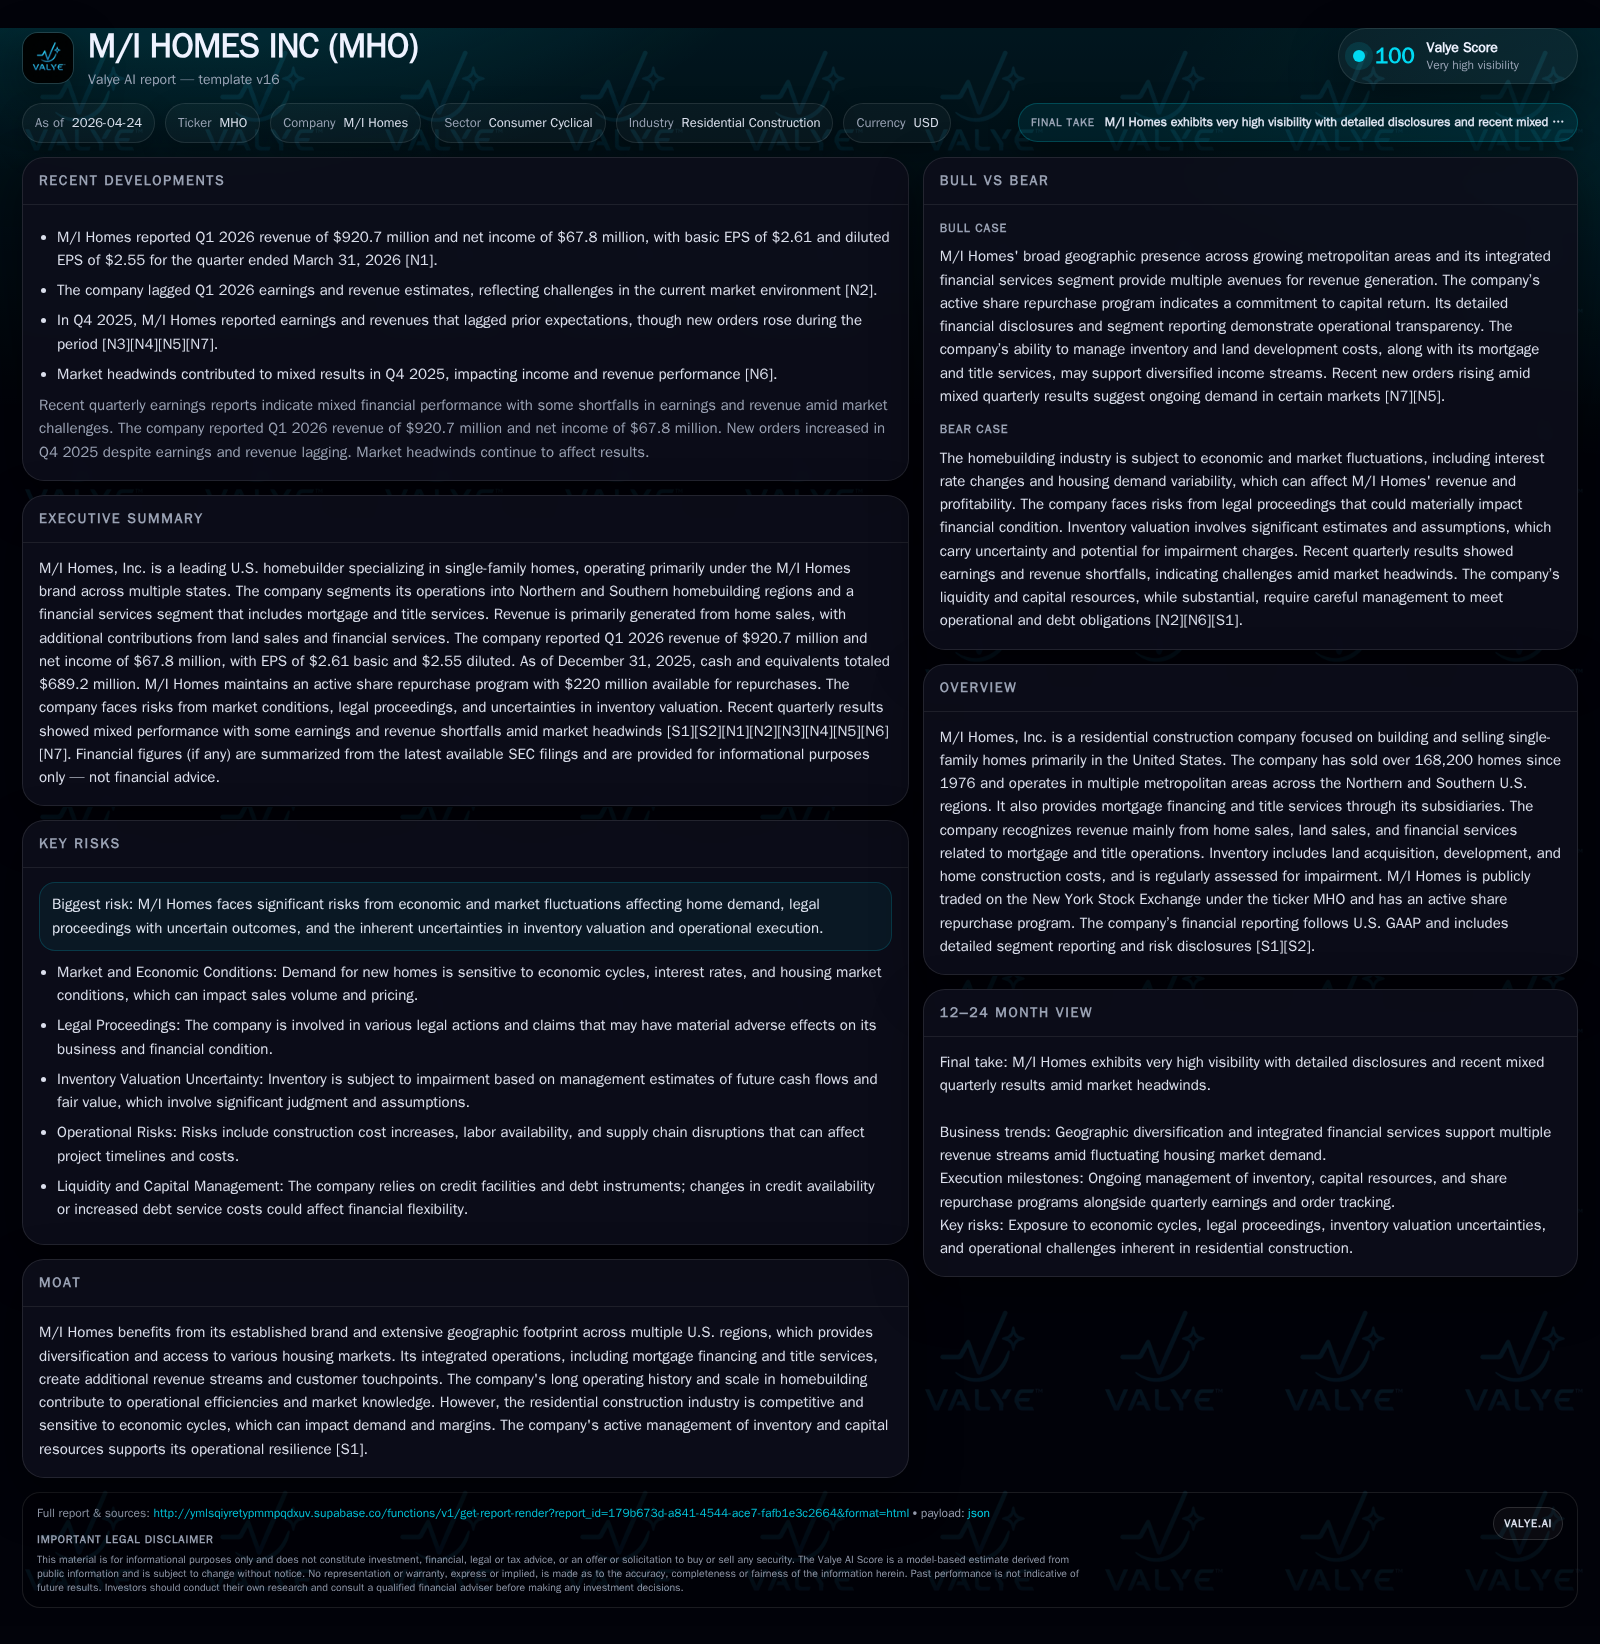
M/I Homes reported Q1 2026 results marked by declines in revenue and operating margins due to elevated mortgage rates and localized warranty cost pressures, notably in Florida. The company’s business model combines homebuilding with mortgage and title services, providing multiple revenue streams and geographic diversification across northern and southern U.S. markets. Despite cyclical headwinds impacting new contracts and home deliveries, M/I Homes maintains operational leverage through scale, strong liquidity, and an active share repurchase program. Going forward, monitoring backlog trends, pricing dynamics, and warranty reserves will be critical to assessing recovery potential.
Latest Quarterly Performance Signals Industry Challenges
M/I Homes’ first quarter of fiscal 2026 disclosures [S2|10-Q filed April 24, 2026] reveal a company grappling with persistent economic headwinds influencing the U.S. residential construction sector. Reported revenue softness aligns with continued elevated mortgage interest rates that have cooled homebuyer enthusiasm. Although exact numerical quarter-over-quarter figures in the release are not disclosed here, accompanying investor commentary confirms missed earnings and revenue expectations [N2], underscoring tightening operating margins.
Particularly notable is the impact of warranty claims related to attic ventilation issues in two Florida communities. Management’s increased warranty reserves triggered through cost-of-sales adjustments reflect real operational challenges that compressed near-term profitability [S1][S2]. Such geographic-specific warranty liabilities exacerbate margin pressure amidst softened gross margins generally declining from prior years.
These factors paint a clear picture: M/I Homes faces cyclicality amplified by discrete repair costs but benefits from structural defenses discussed below. Market sentiment following the earnings transcript [N1] showed investor caution but recognition of resilience built into the company's integrated service offerings.
M/I Homes’ Business Model: Integrated Homebuilding with Finance Services
M/I Homes operates principally as a single-family homebuilder serving diverse metropolitan markets across Northern (e.g., Columbus, Cincinnati, Chicago) and Southern (e.g., Florida cities including Tampa and Orlando, Texas regions like Austin and Dallas) U.S. geographies [S1][S17]. The company’s main profit engine is home sales supported by land acquisitions and development — all managed end-to-end within its divisions.
Distinctively, M/I Homes supplements homebuilding revenues with financial services including mortgage origination facilitation through M/I Financial subsidiaries and title insurance products. This vertical integration fosters a broader customer engagement cycle beyond initial sale contracts by financing buyers internally or via third parties, thus capturing ancillary revenue streams that partially decouple cash flow from pure construction cycles [S1].
Revenue recognition typically follows fulfillment of a single performance obligation—the delivery of a completed home under contract—usually within one year from contract inception. This tight cadence allows agile working capital management relative to multi-year commercial construction peers.
Warranty obligations extend structural guarantees up to decades depending on market (with 10-, 15- or even 30-year coverage options), requiring actuarial evaluation informed by geographic-specific historical claims trends. These reserves are continuously monitored quarterly to ensure adequacy against future liabilities especially as quality standards evolve across markets or specific defect patterns emerge (as seen recently in Florida) [S1].
Competitive Advantages in a Fragmented Housing Market
The U.S. single-family residential construction industry remains fragmented with intense competition from small local builders to large national players. M/I Homes leverages several competitive moats:
- Brand longevity: Over four decades since founding in 1976 with more than 168,200 homes delivered enhances buyer trust.
- Geographic diversity: Operating across multiple states blunts localized downturns or regulatory shocks.
- Operational scale: Volume enables procurement efficiencies amid inflationary cost pressures.
- Integrated financial services: Mortgage/tile operations increase customer touchpoints while adding recurring fee income streams.
Nonetheless, pricing power is challenged during soft demand cycles evidenced by subtle declines in average sales prices during recent periods coupled with discounting necessity to maintain absorption rates.[S1][N5]
Supply chain strains mainly driven by materials inflation remain manageable yet require constant vigilance given construction timelines typically less than one year; labor costs also fluctuate regionally affecting community-level margins.
Demand Drivers and Operational Constraints in Residential Construction
M/I Homes’ growth prospects derive mainly from macroeconomic housing fundamentals such as population growth in served metro areas, mortgage interest rate environments conducive to affordability improvements, consumer confidence measures influencing purchase timing decisions, and regional employment trends supporting income stability.
During calendar year 2025 new contract volumes fell approximately 4%, reflecting a cyclical correction triggered by inflationary pressures combined with high mortgage borrowing costs that limit credit availability for many buyers [S1]. This contraction places clear constraints on top-line expansion.
Operationally, warranty expense volatility exemplifies latent risk exposure; while historical data guides reserve setting practices, unpredictable claim surges can swiftly erode operating income—issues notably concentrated currently in certain Florida developments involving attic ventilation deficiencies [S1].
Additionally, inventory levels encompassing raw land purchases ($1.88 billion), homes under construction ($1.28 billion), and model homes (~$91 million) must be balanced carefully against expected absorption to avoid capital lockup or sales slowdowns disrupting cash flow [S22]. Inflation-driven input cost increases pose margin compression risks unless offset by disciplined price management or productivity gains.
Monitoring Forward Indicators: Backlog, Pricing, and Market Conditions
M/I Homes discloses backlog figures annually but offers segmental qualitative insights quarterly enabling assessment of near-term sales funnel health [S1]. An improving backlog alongside stable or rising average sales prices could signal emergent demand recovery.
Regulatory environments surrounding land entitlement or building codes vary across jurisdictions adding complexity; no material changes were flagged recently but ongoing legal proceedings carry inherent uncertainties detailed under Note 8 of filings [S15], which merit monitoring due to possible impacts on operational or reputational standing.
Mortgage financing capacity within M/I Financial relies on credit facilities expiring October 20, 2026 (MIF Mortgage Repurchase Facility at $200 million commitment plus $100 million uncommitted master facility) carrying SOFR-based variable rates plus margin adjustments tied to leverage ratios; compliance remains intact as of latest filings without signs of constraint but extension uncertainties exist year-to-year per market standard [S5][S6][S7][S8].
Financial Overview: Profitability, Cash Flow, and Capital Allocation
Annual data up to fiscal year-end December 31, 2025 provides context for recent operational narratives:
Historical performance (annual)
| FY | Rev ($bn) | Net ($mm) | CFO ($mm) | OpInc ($mm) | Rev YoY | Net YoY |
|---|---|---|---|---|---|---|
| 2025 | 4.4 | 403 | 137 | 507 | -1.9% | -28.5% |
| 2024 | 4.5 | 564 | 180 | 706 | +11.7% | +21.1% |
| 2023 | 4.0 | 465 | 552 | 587 | -2.4% | -5.2% |
| 2022 | 4.1 | 491 | 184 | 637 |
Source: SEC companyfacts cache [F1].
Capital returns and efficiency (annual)
| FY | Buybacks ($mm) | FCF ($mm) | ROE% |
|---|---|---|---|
| 2025 | 202 | 128 | 12.7 |
| 2024 | 177 | 171 | 19.2 |
| 2023 | 65 | 546 | 18.5 |
| 2022 | 55 | 175 | 23.7 |
Source: SEC companyfacts cache [F1].
Operating income contracted sharply (-28.3% YoY) evidencing margin pressure from warranty charges and demand softness; net income echoed this trend (-28.5%). Operating cash flow declined (-23.6%) but remained positive at $137 million supporting liquidity needs. Capital expenditures rose moderately (+14%), indicating continued investment into community development despite macro uncertainty.[F1]
Balance sheet strength end-year includes sizable equity base exceeding $3.16 billion with conservative net debt around $257 million after cash offsets offering ample borrowing capacity under existing credit agreements expiring beyond forecast horizon.[F1][S4][S20]
Capital return remains prioritized through sustained repurchase programs accumulating $202 million shares retired over FY2025 reflecting management confidence in underlying value even amid earnings variability.[S24]
No material covenant breaches or refinancing risks were noted for the period ending Q1 2026 filings.[S2][S3]
This analysis synthesizes disclosures provided by M/I Homes through SEC filings alongside market commentary to evaluate current operational dynamics without offering investment advice or price guidance.
Disclaimer: This is research-only, informational analysis and not investment advice. It may include AI-generated interpretation and general industry context. Always verify important details using primary sources.
Comments