
Halliburton’s 2026 Q1 Revenue Holds Steady Amid Middle East Disruptions and Shifting Segment Dynamics
Q1 2026 results reflect resilient global services demand with segment mix shifts and focused capital discipline.
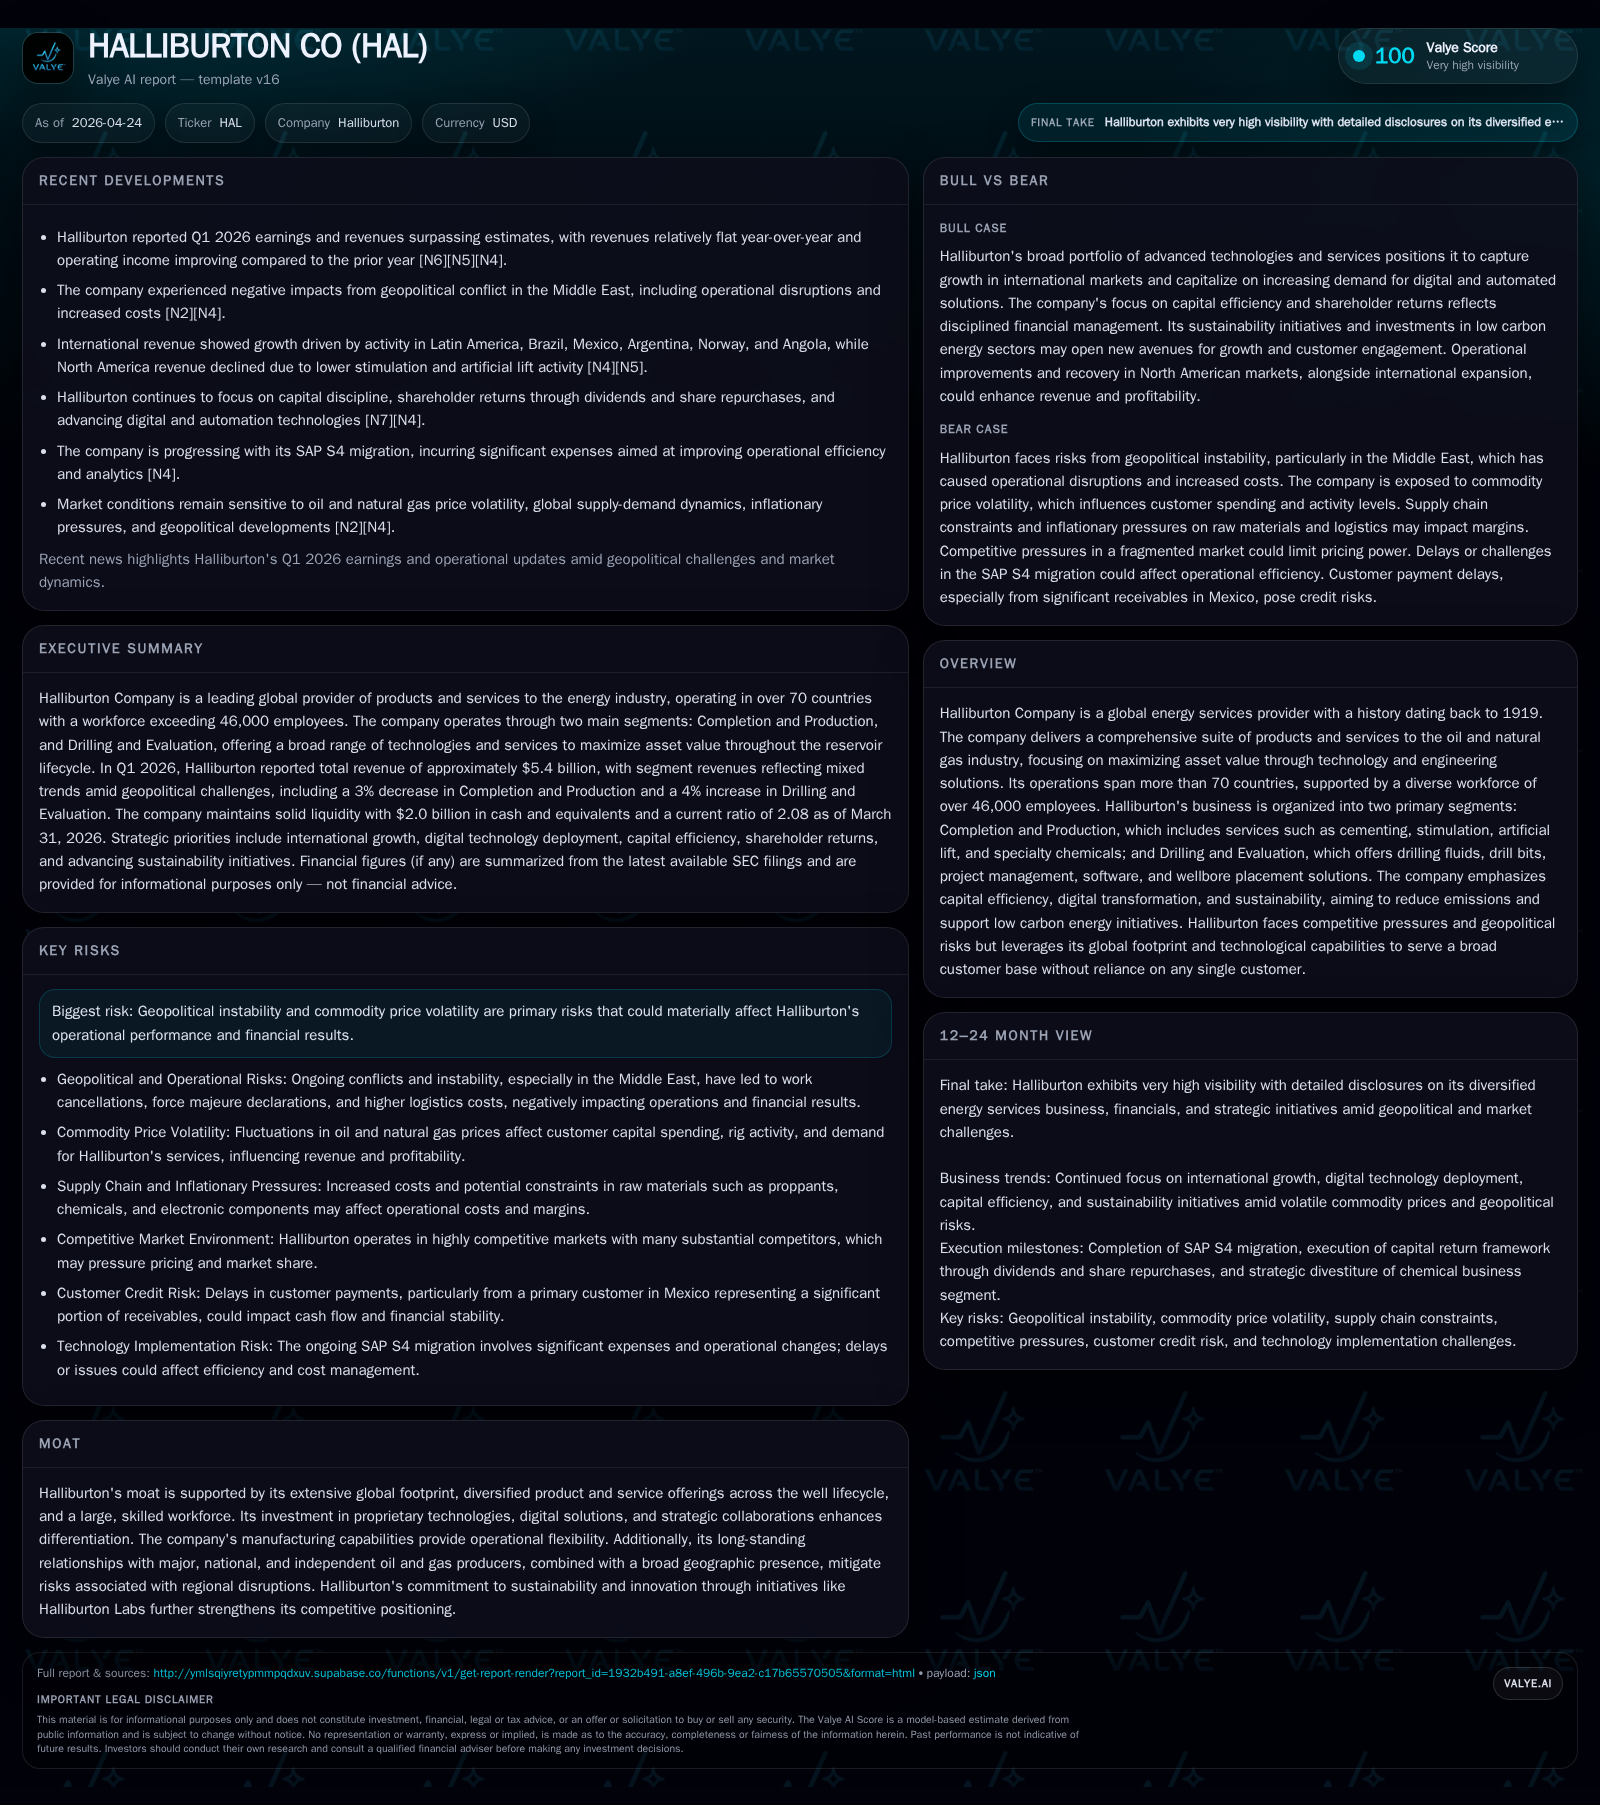
Halliburton reported flat total revenue of $5.4 billion in Q1 2026 versus the prior year, despite a 4% revenue decline in North America and a 13% contraction in the geopolitically challenged Middle East/Asia region. The company’s Completion and Production segment saw a revenue dip largely due to lower stimulation activity and Middle Eastern pressure pumping declines, while Drilling and Evaluation advanced by 4%, driven by Latin America and Europe growth. Operational focus remains on capital efficiency, digital transformation, and international expansion amid ongoing geopolitical and inflationary pressures. Liquidity remains robust with $2 billion cash, manageable debt, disciplined capex near $1.1 billion forecasted for the year, and continued shareholder returns through dividends and buybacks.
Recent Operating Update
Halliburton’s first quarter report filed April 24, 2026 [S2] reveals a company navigating complex geopolitical disruptions while maintaining overall revenue stability. Total revenue was essentially flat at $5.4 billion versus the prior year quarter, but operating income surged to $679 million compared with $431 million in Q1 2025 — a significant improvement after excluding prior year impairments totaling $356 million. Despite uncertainty related to ongoing Middle East conflicts that negatively impacted earnings per share by approximately $0.02–$0.03 across segments, Halliburton’s operational performance showed resilience.
Segment activity diverged: Completion and Production revenues declined 3% primarily from subdued stimulation activities in North America land operations as well as lower completion tool sales and pressure pumping services affected by regional geopolitical issues in the Middle East [S8][S12]. Meanwhile, the Drilling and Evaluation segment achieved a 4% revenue increase fueled by elevated project management work across Latin American markets (notably Ecuador, the Caribbean, Brazil) and enhanced drilling services in Europe [S12][S24].
Geographically, North American top-line dipped by roughly 4%, mainly due to diminished stimulation demand during constrained capital allocation by upstream operators [S12][S19]. The Middle East/Asia region was hit hardest with a steep revenue drop of 13%, reflecting force majeure declarations, cancellations of offshore projects, heightened logistics costs, and other conflict-related disruptions [S12][S19]. Offsetting some declines in Asia were incremental gains in completion tooling sales.
Notable recent portfolio moves include Halliburton’s decision made in late 2024 to market part of its chemical business for divestiture completion expected during Q2 2026, signaling an emphasis on streamlining offerings toward higher-margin or more strategic capabilities [S2].
Business Model Analysis
Halliburton operates as an integrated energy services provider covering the full well lifecycle—from exploration support through drilling execution to well completion and production enhancement—spanning more than 70 countries supported by over 46,000 employees [S1][S9]. Its two main line-of-business segments are:
- Completion & Production: delivering cementing services, hydraulic fracturing (stimulation), specialty chemicals, artificial lift systems, pressure control equipment, well intervention tools, pipeline/process services, production enhancement solutions.
- Drilling & Evaluation: offering drilling fluids (Baroid), drill bits/services, project management oversight, software tools (Landmark), wireline & perforating services, reservoir modeling.
Revenue generation depends heavily on capital budgets from major national and independent oil & gas producers' exploration & development programs. Halliburton’s value proposition centers on leveraging proprietary technologies such as its Zeus IQ electric fracturing system to optimize completions efficiency while cutting emissions—complemented by automation platforms like iCruise rotary steerable systems enhancing well placement precision [S2][S8].
The company's ability to manufacture much of its equipment internally—in US, UK, Malaysia, Singapore—adds strategic flexibility around capital spend pacing amid market volatility [S8]. This vertical integration supports rapid deployment of innovation while controlling costs.
Complementing core oilfield solutions is Halliburton Labs, incubating advanced energy tech startups targeting low-carbon initiatives including carbon capture utilization/storage (CCUS) and geothermal power generation partnerships such as VoltaGrid behind-the-meter projects [S2][S25]. Digital transformation efforts extend across operations aiming for data-driven decision making that boosts asset recovery rates for clients.
Industry Structure & Competitive Position
Halliburton competes within a tightly contested global oilfield services sector alongside peers like Schlumberger, Baker Hughes, Weatherford, among others. Industry dynamics are strongly cyclical yet increasingly shaped by structural shifts toward sustainability mandates and technological integration.
Its moat derives from large scale global reach supporting ~146 nationalities globally; diversified service platforms cutting across multiple stages of oilfield development; significant R&D investment; proprietary tech stacks; longstanding client relationships mitigating customer concentration risks; advanced manufacturing capabilities; plus increasing footprint in international emerging oil & gas regions including Latin America [S1][S8][N14].
Ongoing challenges exist from geopolitical instability affecting access & activity levels—especially volatile hotspots such as the Middle East—as well as raw material supply constraints (chemicals, proppants)... However these are offset partially by rapid adaptation leveraging digital platforms that deliver client cost-efficiencies under capital discipline environments [S19].
Growth Drivers & Constraints
Drivers:
- Rising international investment notably in Latin America (+22% Q1 revenue growth) supported by higher stimulation activity in Mexico/Argentina.
- Expanding demand for digital-enabled automated drilling/completion solutions accelerating productivity.
- Transition toward electric fracturing fleets reducing emissions intensity aligns with client sustainability goals.
- Near-term uptick in oil prices — WTI averaging ~$72/bbl early ’26 — encouraging spending resumption.
- Large installed base enabling cross-selling complementary services.
Constraints:
- Geopolitical disruptions remain acute especially Middle East/Asia impacts curtailing activity volumes.
- Customer capital discipline limits spending flexibility reducing demand for stimulation/artificial lift.
- Inflationary pressures on chemical inputs/logistics challenging margin maintenance despite partial cost pass-through capabilities.
- Potential regulatory risks related to hydraulic fracturing disclosure regulations could impose operational limitations [S28].
- Ongoing SAP S4 enterprise systems migration incurs quarterly expenses (~$45M forecasted) potentially weighing on margins short term.
What To Watch Next
Key monitoring points include:
- Completion of chemical business sale expected Q2 2026 will clarify impact on segment financials.
- Execution progress of international expansion strategies especially scale-up in Latin America/artificial lift penetration.
- Adoption rates of Zeus IQ electric fracturing pumps relative to legacy hydraulic fleets signaling potential margin uplift.
- Capital market conditions influencing customer upstream budgets and resultant service demand sustainability.
- Resolution or escalation of Middle East geopolitical events affecting operations continuity or causing additional force majeure claims.
- Evolution of digital platform integrations driving operational efficiencies internally plus customer adoption metrics.
- SAP S4 system rollout milestones matched against anticipated efficiency gains over subsequent quarters.
- Share repurchase activity pace vs announced authorization ($1.9B remaining) as indicator of confidence in FCF generation outlook [S6].
Financial Profile (Latest Quarter Context)
At March 31, 2026 closing cash stood at approximately $2.0 billion down modestly from $2.2 billion at year-end '25 with an available revolving credit facility of $3.5 billion ensuring liquidity headroom [S2][F1]. Total debt was last reported near $7.16 billion end-March ‘25 with net debt estimated around $5.15 billion [F1], supported by stable credit ratings BBB+ (Long-term S&P) / A3 (Moody's) with stable outlooks [S5].
Operating cash flow for Q1 was $273 million with negative working capital impact (-$252M) partially offsetting operating inflows due mostly to receivables/inventory changes alongside payables timing variance [S2]. Capital expenditures totaled $192 million consistent with targeted full year spend guidance near $1.1 billion aimed at technology investments plus capacity deployments maintained at circa ~6% of annual revenues [S2][S15].
In shareholder returns focus: Halliburton paid dividends totaling $142 million during Q1 alongside repurchase of 2.8 million shares at cost of roughly $100 million under its existing authorization framework targeting >50% of free cash flow returns annually [S6][F1]. The firm maintains no material financial covenants or adverse provisions restricting operational flexibility with minimal near-term maturity pressures (~$90M Feb ’27 principal due) highlighting manageable leverage profile balanced against ongoing free cash flow generation capability [S5][F1].
Historical performance (annual)
| FY | Net ($bn) | CFO ($bn) | OpInc ($bn) | Capex ($mm) | Net YoY |
|---|---|---|---|---|---|
| 2025 | 1.3 | 2.9 | 2.3 | 1254 | -48.7% |
| 2024 | 2.5 | 3.9 | 3.8 | 1442 | -5.2% |
| 2023 | 2.6 | 3.5 | 4.1 | 1379 | +67.8% |
| 2022 | 1.6 | 2.2 | 2.7 | 1011 |
Source: SEC companyfacts cache [F1].
Capital returns and efficiency (annual)
| FY | Buybacks ($mm) | FCF ($bn) | ROE% |
|---|---|---|---|
| 2025 | 1007 | 1.7 | 12.3 |
| 2024 | 1005 | 2.4 | 23.8 |
| 2023 | 800 | 2.1 | 28.1 |
| 2022 | 250 | 1.2 | 19.8 |
Source: SEC companyfacts cache [F1].
Note: Latest annual figures provide context to current quarterly trends.
Disclaimer
This analysis is based solely on publicly available filings ([S#], [F1]) as of April 24, 2026 and does not constitute investment advice or recommendations regarding Halliburton Company securities or operations.
Disclaimer: This is research-only, informational analysis and not investment advice. It may include AI-generated interpretation and general industry context. Always verify important details using primary sources.
Comments