
WiMi Hologram Cloud Advances Despite Revenue Decline and Intensifying Market Challenges
WiMi's latest quarter reaffirms its commitment to AR and semiconductor R&D amid evolving competitive and regulatory landscapes.
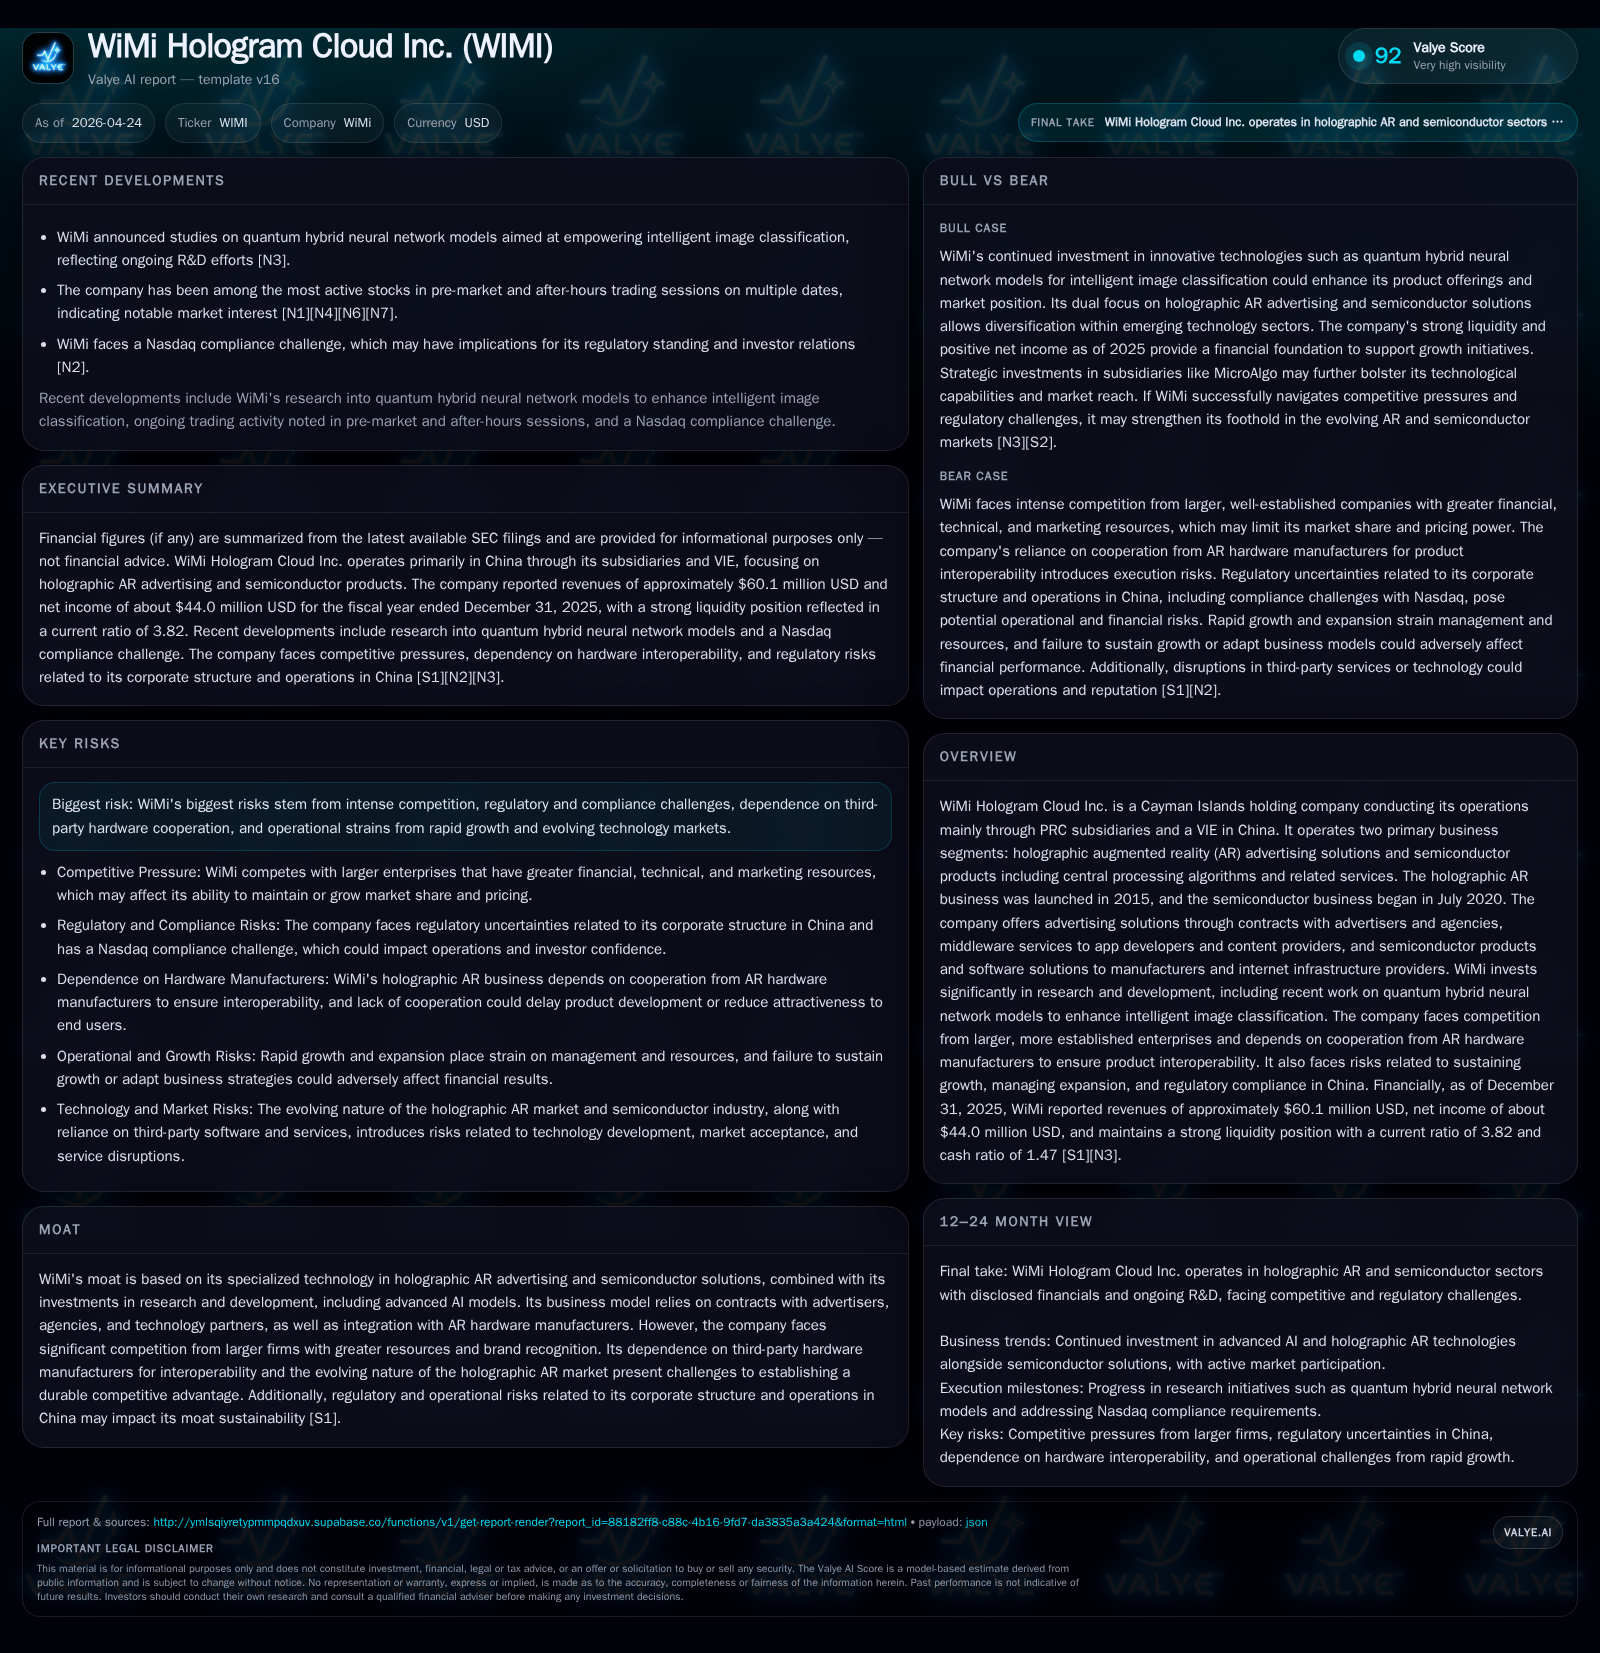
WiMi Hologram Cloud Inc.’s Q1 2026 disclosures confirm ongoing operational stability supported by substantial liquidity. Its dual focus on holographic AR advertising and semiconductor solutions underscores a differentiated, albeit capital-intensive, model challenged by competition and evolving PRC regulations. Declining revenues in 2025 contrast with improved net income profitability, reflecting operational adjustments amid cyclical industry pressures. The company’s growth trajectory hinges on sustaining R&D innovation, navigating hardware interoperability constraints, and managing regulatory compliance risks linked to its China-based VIE structure.
Recent Operating Update
WiMi Hologram Cloud Inc.'s latest quarterly filing dated April 24, 2026 [S2] provides confirmation of operational continuity without significant events altering its business dynamics. The filing predominantly serves the routine SEC compliance function under the Exchange Act section 13a-16. Prior disclosures around board composition reflect March 2026 appointments replacing several departing directors including a Chief Technology Officer resignation [S3], indicating some refreshment at the governance level but without reported disruptions to technical or sales operations. These governance developments bear watching as leadership stability can materially impact execution capability in fast-moving tech sectors.
The absence of further substantive quarter-specific financial detail in the most recent interim filings places heavier reliance on the comprehensive annual report filed concurrently [S1]. This annual filing offers the definitive snapshot through December 31, 2025 measuring both financial performance and strategic posture going into the current year.
Business Model
WiMi operates chiefly through its PRC subsidiaries and relies on a variable interest entity (VIE) structure common among Chinese tech firms that restricts foreign ownership in certain sectors. Their business bifurcates into two primary streams:
Holographic Augmented Reality (AR) Advertising Solutions: Launched in 2015, this segment centers on delivering holographic AR content integrated into digital advertising campaigns. Monetization comes from contracts with advertisers and agencies supplemented by middleware licensing agreements made available to app developers and content providers. This model banks on growing AR content consumption and corresponding advertiser shift toward immersive formats.
Semiconductor Products and Services: Introduced mid-2020, this newer line encompasses central processing units with custom algorithmic software designed for AI-enhanced image processing alongside related semiconductor devices. These offerings target electronic manufacturers and internet infrastructure service providers requiring specialized hardware-software synergy for next-gen computing.
Significantly, WiMi pursues continuous investment in research & development including advanced fields like quantum hybrid neural networks aimed at intelligent image classification enhancements — positioning itself beyond pure AR content into foundational technology development [S1][S4][S22].
Revenue generation is inherently contract-based, spanning advertising clients to semiconductor hardware customers with corresponding embedded software licenses.
Industry Structure and Competitive Position
WiMi operates at the intersection of two complex industries:
- The rapidly evolving holographic AR market, characterized by emerging consumer use cases but fragmented hardware ecosystems primarily governed by large device manufacturers.
- The semiconductor space focusing on AI-driven processing, which is capital intensive with high entry barriers but faces stiff competition from incumbents owning scale advantages in fabrication technology and distribution.
WiMi's specialty technology portfolio creates a niche technological moat founded on integrated AR-hardware compatibility and proprietary AI models. However, according to risk disclosures [S1][S11][S12], the durability of this moat is challenged by:
- Competition from firms with deeper capital reserves,
- Dependency on cooperation from third-party AR hardware producers whose reluctance could impair WiMi's interoperability,
- Regulatory complexities stemming from its Cayman holding company structure funneling operations through Chinese VIEs,
- And emerging competitors developing alternative holographic or AI platforms.
This competitive pressure constrains pricing power especially within advertising where demand volatility interacts with macroeconomic cycles influencing marketing budgets [S9]. Moreover, as the company expands semiconductor offerings, it faces entrenched industry participants dominating supply chains.
Growth Drivers and Constraints
Growth Drivers:
- Increasing adoption of augmented reality technologies across digital advertising creates opportunities for monetization growth as brands seek differentiation.
- Semiconductor demands grow due to rising AI-based image recognition requirements; WiMi’s specialized CPU offerings target this expanding niche.
- Continued R&D efforts particularly in AI innovations (e.g., quantum hybrid neural networks) promise product enhancement that could unlock new markets or improve pricing leverage [S22].
- Strategic partnerships or licensing deals with AR hardware makers could accelerate reach if successfully negotiated.
Growth Constraints:
- Revenue for FY 2025 declined approximately 20% YoY from $75 million to $60 million according to [F1], signifying potential softness in core advertising business or product transitions.
- Regulatory constraints tied to currency conversions, offshore funding flows, and foreign investor restrictions described in detail limit capital agility [S1][S6].
- Hardware dependency poses technological integration risks; failure to access key APIs or standards could thwart product effectiveness or delay launches [S17].
- Legal risks encompassing intellectual property disputes or compliance investigations introduce uncertainty around costs and reputation [S5][S25].
- Customer concentration risk combined with competitive pricing pressure challenges margin sustainability very typical of emerging tech sectors reliant on nascent demand patterns [S9][S15].
What to Watch Next
Stakeholders should monitor key upcoming catalysts such as:
- Quarterly top-line revenue trends as a gauge of recovery or further contraction post-2025 slowdown.
- Announcements concerning new product integrations or semiconductor chipset rollouts that leverage recent AI research breakthroughs.
- Updates on regulatory environment developments specifically those affecting VIE structures or cross-border financing.
- Progress on securing deeper hardware manufacturer collaboration validating ecosystem lock-in potential.
- Management commentary addressing competitive landscape shifts or pricing strategy responses following latest results.
- Employee retention rates especially technical executives amidst recent board changes which may influence innovation pace.
Financial Profile
According to the latest annual data reported as of December 31, 2025 [F1]:
Historical performance (annual)
| FY | Rev ($mm) | Net ($mm) | CFO ($mm) | OpInc ($mm) | Rev YoY | Net YoY |
|---|---|---|---|---|---|---|
| 2025 | 60 | 44 | 17 | -5 | -20.3% | +341.5% |
| 2024 | 75 | 10 | 74 | -4 | -8.8% | +116.8% |
| 2023 | 83 | -59 | 13 | -87 | -15.6% | -15.8% |
| 2022 | 98 | -51 | -34 | -44 |
Source: SEC companyfacts cache [F1].
Capital returns and efficiency (annual)
| FY | FCF ($mm) | ROE% |
|---|---|---|
| 2025 | 8 | 14.0 |
| 2024 | 74 | 7.2 |
| 2023 | 3 | -55.9 |
| 2022 | -34 | -34.0 |
Source: SEC companyfacts cache [F1].
Key observations:
- Revenue declined by roughly one-fifth in 2025 versus prior year indicating contraction possibly linked to market softness or strategic repositioning.
- Despite operating losses persisting (~$5.5M), net income surged benefiting from non-operating gains or tax effects driving positive bottom-line turnaround.
- Operating cash flow halved relative to prior year but remained positive supporting operational sustainability without immediate financing needs.
- Capex surged notably reflecting intensifying investments in technology platforms essential for future competitiveness.
- Strong equity base over $314M provides buffer though operating losses highlight profitability challenges requiring monitoring.
Current assets stand robustly at over $501 million with current liabilities around $131 million yielding a solid current ratio of about 3.82 suggestive of healthy short term liquidity ([F1]). Cash plus equivalents exceed $186 million against negligible debt near $4.3 million equating to significantly negative net debt providing balance sheet flexibility into investment cycles ([F1]).
This analysis integrates publicly available SEC filings up to April 24th, 2026 alongside structured financial data but does not constitute investment advice.
Disclaimer: This is research-only, informational analysis and not investment advice. It may include AI-generated interpretation and general industry context. Always verify important details using primary sources.
Comments