
FirstCash’s Q1 2026 Growth Fueled by Pawn Expansion and Retail POS Integration
Strong first-quarter results underscore FirstCash Holdings’ dual-segment strategy in pawn lending and lease-to-own retail finance.
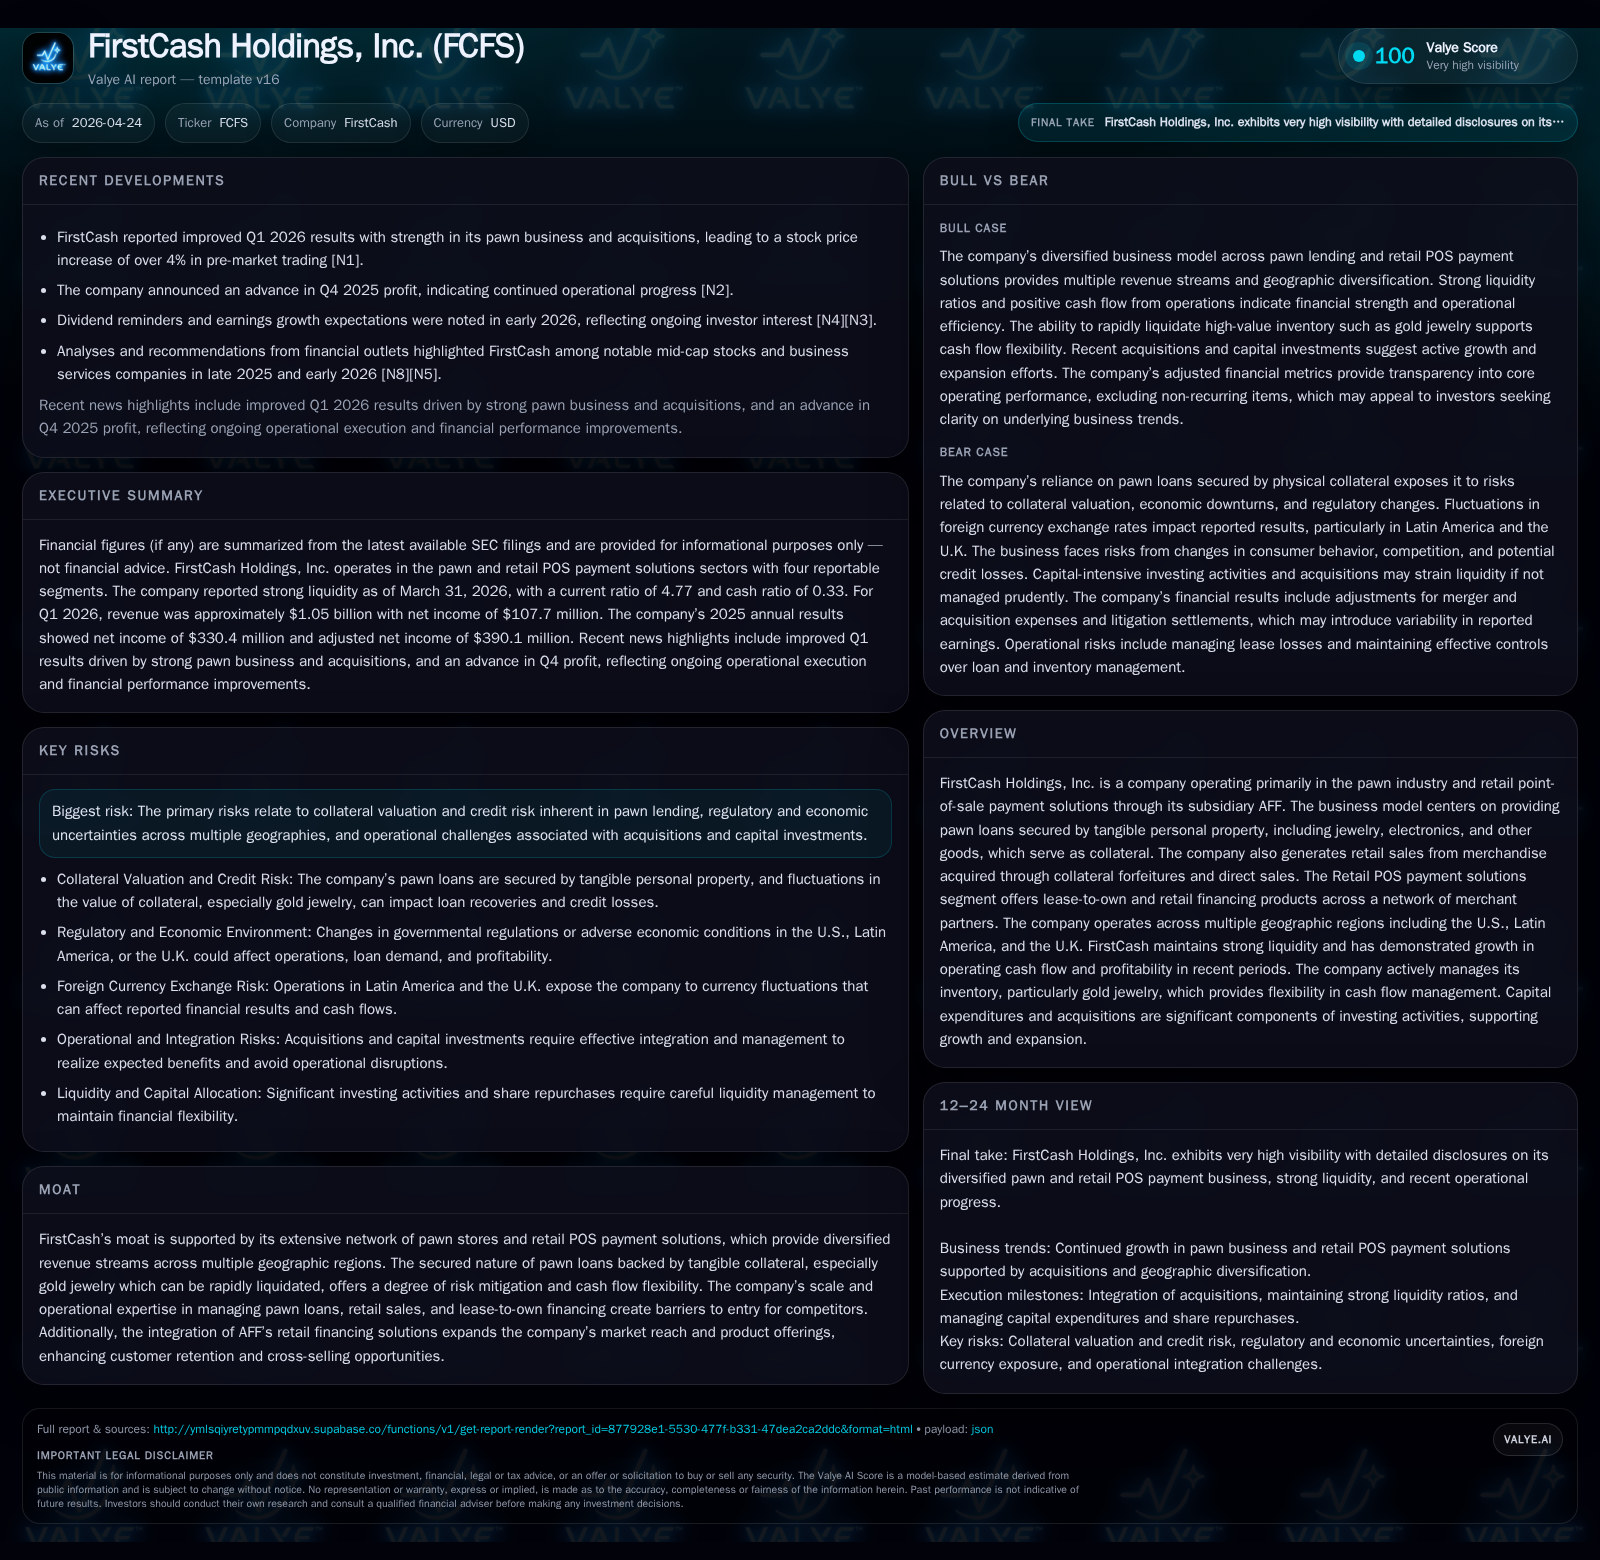
FirstCash Holdings, Inc. reported encouraging results for Q1 2026, driven by robust performance in its core pawn operations and continued integration of its retail point-of-sale payment solutions segment. The company’s business model leverages secured pawn loans backed primarily by liquid collateral such as gold jewelry, while the lease-to-own offerings through AFF expand its consumer reach and diversify revenue streams. Operating cash flow growth and effective inventory management support strong liquidity, despite substantial ongoing acquisition investments. However, growth remains subject to collateral valuation risks, regulatory environments across geographies, and economic factors affecting customer repayment behavior.
Recent Operating Update In the first quarter of 2026, FirstCash Holdings, Inc. reported continued strength driven by its diversified business lines combining traditional pawn operations with a growing lease-to-own (LTO) retail finance platform under AFF [S2], [S3]. The Q1 earnings release dated April 23, 2026 detailed improvements over prior periods primarily reflecting higher pawn loan balances and increased retail merchandise sales across U.S. and Latin America locations. Management declared a second-quarter cash dividend of $0.42 per share signaling confidence in ongoing cash generation [S3]. This near-term momentum confirms successful integration of recent acquisitions such as the H&T stores in the U.K., executed in August 2025, which broadened FirstCash's international exposure while adding complexity to operations [S1], [S4]. Despite elevated capital deployment—net cash used in investing activities rose sharply due to acquisitions and store expansions—the company maintained healthy operating cash flow conversion validated by an increase from $540 million in 2024 to nearly $586 million in 2025 [F1], [S1]. These dynamics underscore FirstCash's strategy to leverage both organic growth within existing stores and bolt-on M&A to enhance scale. ## Business Model FirstCash operates primarily within two interconnected segments: pawn operations spanning the U.S., Latin America (Mexico, Guatemala, El Salvador, Colombia), and U.K., and retail POS payment solutions through its wholly-owned subsidiary AFF. The core pawn business generates revenue principally from interest on short-term loans secured by tangible collateral—most notably jewelry (gold accounting for approximately 62% of inventory), electronics, tools, and other valuable goods [S1], [S22]. Customers pledge items for cash loans typically lasting up to four months; failure to redeem results in forfeiture enabling sale of the collateral as merchandise. This secured nature affords FirstCash a risk mitigation advantage uncommon in unsecured lending—collateral can often be quickly liquidated at market or wholesale values that track prevailing commodity prices such as gold. Consequently, inventory management strategically focuses on maintaining flexible holdings that can be converted if needed to augment liquidity or offset defaults. Meanwhile, AFF provides lease-to-own financing facilitating consumer purchases via a network of merchant partners offering durable goods and services. This segment diversifies revenue through finance receivable interest and fees alongside leased merchandise income [S22]. The partnership with a Utah-based bank enables underwriting control externalization for some products while FirstCash retains servicing rights—demonstrating an ecosystem approach that balances risk with expanded market access. Revenue streams include:
- Pawn loan fees
- Retail merchandise sales sourced from forfeited collateral or direct purchase
- Wholesale scrap jewelry sales
- Leased merchandise income
- Interest and fees on finance receivables tied to AFF’s portfolio [S22] The coexistence of these segments supports cross-selling opportunities—for instance, AFF's LTO leasing products can be offered across physical pawn stores—and provides resilience against localized economic or regulatory shifts. ## Industry Structure and Competitive Position FirstCash commands a sizeable presence across differentiated regional markets where barriers include regulatory compliance, operational expertise managing collateral valuation cycles, and economies of scale in retail footprint management. Its U.S.-heavy footprint is complemented by expansion in Latin America where informal credit demand remains robust amid limited traditional banking penetration. The acquisition of H&T Holdings broadened geographic diversity into the U.K., allowing access to developed markets with different regulatory environments but potential synergies given customer overlap and operational practices [S1], [S4]. This diversification mitigates country-specific or currency-related risks. Competition exists both from smaller local pawn operators as well as alternative lenders including payday loan companies and fintech platforms targeting similar customer credit profiles; however, FirstCash’s scale affords superior pricing power on loan fees and better sourcing of quality inventory for resale. Additionally, AFF’s network-based retail financing differentiates it from pure-play LTO competitors via technology-enabled merchant onboarding and financing flexibility. Operationally, FirstCash benefits from long-standing relationships with suppliers and customers combined with institutionalized risk control frameworks overseeing collateral appraisal standards, loss allowances for finance receivables, and proactive cyber-risk governance overseen at board level [S1]. Similarly, evaluating AFF’s originations volume through merchant channels will highlight scalability prospects. Further acquisitions remain possible given management’s active M&A posture observed in recent quarters; any announced deals should be assessed for geographic fit and anticipated earnings accretion. Additionally, margin trajectory influenced by operational efficiencies (lease expense discipline) alongside inventory turnover around gold jewelry valuations warrants attention as inflationary effects persist. Changes to regulatory frameworks or litigation outcomes outlined under risk factors may also materially alter business conditions. Cash flow generation relative to capital expenditures will indicate how well FirstCash balances growth initiatives against financial flexibility. Given dividend declarations continue steadily alongside share repurchase authorizations resumed post-H&T acquisition integration phase signals management’s confidence yet prudent capital stewardship. ## Financial Profile Summary Using the latest annual financial snapshot ([F1]) through December 31, 2025:
Historical performance (annual) | FY | Rev ($bn) | Net ($mm) | CFO ($mm) | Capex ($mm) | Rev YoY | Net YoY |
| --- | :---: | :---: | :---: | :---: | :---: | :---: | | 2025 | 3.7 | 330 | 586 | 55 | +8.0% | +27.6% | | 2024 | 3.4 | 259 | 540 | 68 | +7.5% | +18.0% | | 2023 | 3.2 | 219 | 416 | 60 | +15.5% | -13.5% |
| 2022 | 2.7 | 253 | 469 | 36 | | | Source: SEC companyfacts cache [F1]. ### Capital returns and efficiency (annual) | FY | Div ($mm) | Buybacks ($mm) | FCF ($mm) | | --- | :---: | :---: | :---: | | 2025 | 71 | 116 | 531 | | 2024 | 66 | 85 | 472 | | 2023 | 62 | 114 | 356 | | 2022 | 60 | 158 | 434 | Source: SEC companyfacts cache [F1]. Liquidity remains solid with a current ratio of 4.55 supported by $1.86 billion in current assets against $408 million in current liabilities at year-end 2025 [F1]. Net debt stood near $2.1 billion, reflecting total debt less cash reserves [F1]. Operating cash flow demonstrated steady growth (+9%) even as capex declined (-19%), reflective of scaled operating efficiency despite heavy investing activities primarily around acquisitions detailed above [F1], [S1]. Capital allocation reflects an active program with approximately $116 million deployed towards share repurchases in FY2025 after completing previous buyback authorizations plus consistent dividend payouts amounting to $71 million during the same period [F1], [S11]. Interest expense increased commensurately due to incremental borrowings related to deals like H&T but remains manageable within EBITDA coverage metrics outlined by credit covenants observed to be in compliance at all reporting dates [S4], [S6]. ## Disclaimer This analysis is based on publicly filed financial statements and disclosures available as of April 24, 2026. It aims to provide an objective overview without investment recommendations or price targets.
Disclaimer: This is research-only, informational analysis and not investment advice. It may include AI-generated interpretation and general industry context. Always verify important details using primary sources.
Comments