
Carlisle Companies Shows Mixed Signals with Q1 Earnings Beat and Organic Revenue Dip
Q1 2026 results highlight strong earnings performance offset by declining organic revenues, underscoring challenges within Carlisle’s multi-segment industrial portfolio.
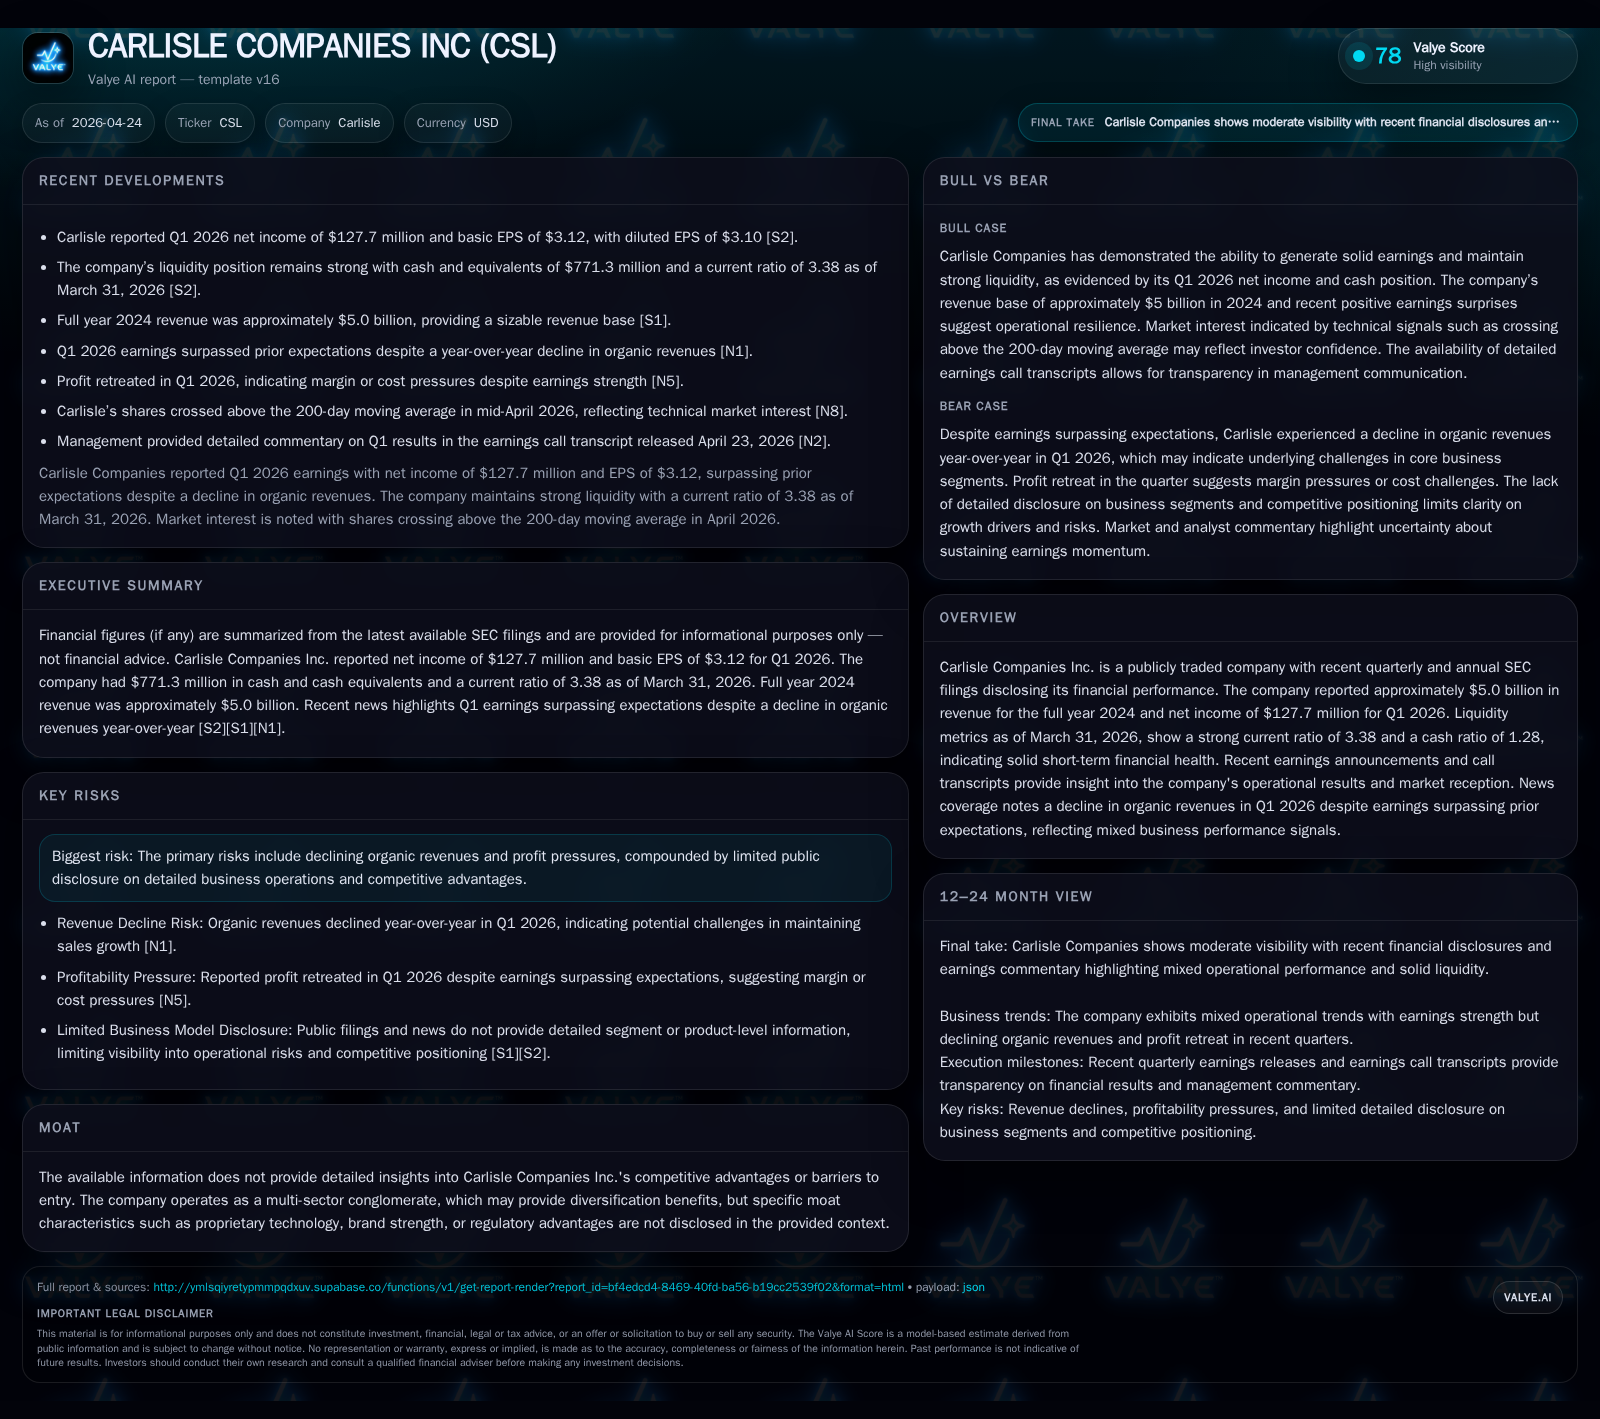
Carlisle Companies surprised the market in Q1 2026 by surpassing earnings expectations despite a noticeable decline in organic revenues. The company’s diverse industrial business model provides some resilience, but the organic revenue drop signals demand headwinds across key segments. Carlisle’s liquidity remains robust, supporting operational flexibility amid uneven macroeconomic conditions and execution risks. Monitoring future organic revenue trends and margin management will be critical for assessing sustainability of near-term growth.
Q1 2026 Operating Update: Earnings Outperformance Amid Revenue Challenges
In its latest 10-Q filing dated April 24, 2026 [S2], Carlisle Companies reported Q1 net income of approximately $127.7 million, surpassing analysts’ expectations despite underlying softness in core business volumes [N1]. Organic revenues declined year-over-year indicating weaker demand across multiple segments, yet disciplined cost controls and operational efficiencies helped protect margin profiles [N2]. The juxtaposition of an earnings beat against top-line pressures suggests that price realization and expense management partially offset volume headwinds.
Detailed commentary during the April earnings call [N2] emphasized the mixed operating environment, with management acknowledging slower-than-expected customer activity in industrial end markets. However, pricing remained relatively stable supported by continued raw material cost pass-through mechanisms. Carlisle’s ability to maintain profitability despite contracting organic volumes likely reflects both segmental product mix resilience and temporary timing factors.
The recent 8-K filing dated April 23 [S3] reinforced this narrative by highlighting that while underlying demand softness persists, proactive margin improvement initiatives remain underway. Investors face a near-term tradeoff between suboptimal organic sales trends and continued pricing discipline plus cost leverage. This dynamic sets a tone of cautious optimism tempered by tangible execution challenges.
Diverse Business Model: Multi-Segment Revenue Streams and Product Quality
According to Carlisle's comprehensive annual report on Form 10-K from February 13, 2026 [S1], the company aggregates multiple industrial businesses under one corporate umbrella. Its portfolio includes building materials (roofing systems, sealants), specialty products (coatings, adhesives), and engineered systems (transport refrigeration components, aerospace seals). Such a multi-segment structure introduces varying cyclicality profiles which can mitigate volatility but also raise managerial complexity.
Carlisle's products often serve critical infrastructure applications where quality and reliability command pricing premiums—attributes supported by enduring customer relationships. While no proprietary technologies or distinct regulatory moats are explicitly detailed [S1], the diversified product set provides some insulation against downturns concentrated in individual sectors. That said, this diversification trades off simplicity for operational breadth requiring tight coordination to optimize returns.
This quality/reliability focus is evident in longer product lifecycles and associated warranty commitments outlined in filings [S1]. Customers depend on consistent performance particularly in construction and transportation industries where failures can entail costly downtime or compliance risks. Carlisle’s capability to service these needs underpins its value proposition despite competitive pressures.
Competitive Context: Industry Structure and Carlisle’s Market Position
Carlisle operates in a competitive arena alongside diversified industrial giants such as Honeywell, 3M, and ITT Industries [N12]. These peers often overlap in some specialty segments but differ broadly across the strength of global scale, innovation pipelines, and branded customer loyalty.
While Carlisle's broad exposure across multiple market verticals confers some risk spreading benefits [S1], it lacks overt regulatory advantages or significant intellectual property defenses commonly found in more technology-intensive competitors. Pricing power appears heterogeneous: segments tied closely to commodity-related inputs face more limited leverage than highly specialized engineered systems.
Supply chain disruptions have intermittently affected raw material availability industry-wide; Carlisle has managed these through sourcing diversification without major interruptions noted recently [N12]. However, cyclical demand pressures remain prominent as reflected by declining organic revenues in Q1 [S2]. Overall market penetration benefits from established distribution channels though switching costs are moderate given commoditized elements within certain product lines.
Growth Catalysts and Barriers Within Product Lines and Market Segments
Key growth drivers for Carlisle include rebound potential in global construction activity—especially commercial roofing—and innovation-led expansion in engineered solutions that address evolving environmental standards [S1]. The annual report details ongoing R&D investments targeting higher-margin product variants designed for durability or energy efficiency enhancements.
Geographic expansion into emerging markets also offers incremental revenue opportunities albeit accompanied by challenges such as local competitive intensity and regulatory compliance complexity. Still, Carlisle’s multi-segment footprint affords it flexibility to allocate capital toward faster-growing opportunities where feasible.
Conversely, Q1 softness highlighted by organic revenue declines denotes cyclical headwinds primarily linked to macroeconomic uncertainty impacting end-customer capital expenditures [S2]. Margin pressures could intensify if pricing fails to keep pace with inflationary cost inputs or if lower volumes reduce fixed cost absorption efficiency.
Capacity constraints do not appear acute currently but remain potentially relevant should demand recover sharply—indicating room to balance operational scalability targeted through targeted capital expenditures outlined annually [S1]. The interplay of secular market shifts versus short-term cyclicality merits close observation going forward.
Monitoring Forward: Key Milestones, Guidance, and Execution Risk Areas
Post-Q1 investor focus will likely center on management’s updated outlook regarding organic revenue trajectory — critical for validating whether recent declines are transient or symptomatic of broader weakness [N2][S3]. Progress on margin enhancement programs aimed at sustaining profitability amidst volume swings also represents an important gauge of execution discipline.
Further guidance issued during or after the upcoming quarterly earnings release will be pivotal in setting near-term sentiment around growth sustainability. Market participants will scrutinize any commentary on raw material inflation pass-through capacity alongside innovation commercialization progress.
Additional milestones include monitoring integration success of any recent acquisitions or divestitures that impact segmental mix plus evidence of improving order books signaling stabilization. Historically unpredictable demand patterns elevate execution risk making operational agility essential for maintaining financial targets.
Financial Summary: Balance Sheet Strength and Cash Flow Analysis
Historical performance (annual)
|
| FY | Rev ($bn) | Net ($mm) | CFO ($mm) | OpInc ($mm) | Rev YoY | Net YoY |
|---|---|---|---|---|---|---|
| 2025 | 741 | 1102 | 1003 | -43.5% | ||
| 2024 | 5.0 | 1312 | 1030 | 1143 | +343.8% | +538.3% |
| 2023 | 1.1 | 206 | 1201 | 254 | -82.9% | -77.8% |
| 2022 | 6.6 | 924 | 1001 | 1276 | +37.0% |
Source: SEC companyfacts cache [F1].
Capital returns and efficiency (annual)
|
| FY | Div ($mm) | Buybacks ($mm) | FCF ($mm) |
|---|---|---|---|
| 2025 | 181 | 1300 | 971 |
| 2024 | 172 | 1586 | 917 |
| 2023 | 160 | 900 | 1059 |
| 2022 | 134 | 400 | 817 |
Source: SEC companyfacts cache [F1].
Carlisle maintains a solid financial footing as evidenced by its liquidity metrics at quarter-end March 31, 2026: a current ratio of approximately 3.38 and cash ratio near 1.28 supported by $771 million cash & equivalents [F1]. Current assets significantly exceed current liabilities ($2.03 billion vs $0.60 billion), providing a comfortable short-term cushion [F1].
Total reported debt stands at about $596 million historically available from company facts but appears manageable relative to cash holdings resulting in negative net debt when adjusted [$175 million net cash position indicated] [F1]. This conservative leverage profile underpins financial flexibility in capital deployment decisions including dividends (inal FY2025 payout around $181 million) and sizable share repurchases exceeding $1.3 billion annually urther confirmed within recent event disclosures [F1][S5].
Operating cash flow remains robust above $1 billion annually with free cash flow generation near $970 million (operating cash flow less capex) indicating strong internal funding capability supporting both growth investments and shareholder returns [F1]. Capital expenditures reflect disciplined allocation prioritizing capacity modernization over aggressive expansion.
Overall financial health supports Carlisle’s operational resilience amid fluctuating organic revenue conditions though vigilance towards maintaining margins against input cost volatility will be paramount going forward.
This analysis is based solely on publicly available information from latest SEC filings dated up to April 24, 2026 ([S1], [S2], [S3]) supplemented by companyfacts data ([F1]) and select news sources (). It does not constitute investment advice or recommendations.
Disclaimer: This is research-only, informational analysis and not investment advice. It may include AI-generated interpretation and general industry context. Always verify important details using primary sources.
Comments