
Community Bancorp’s Regional Focus Drives Loan Growth Amid Interest Rate and Liquidity Constraints
The Vermont-based bank holding company leverages strong local ties and real estate-secured lending for steady earnings expansion.
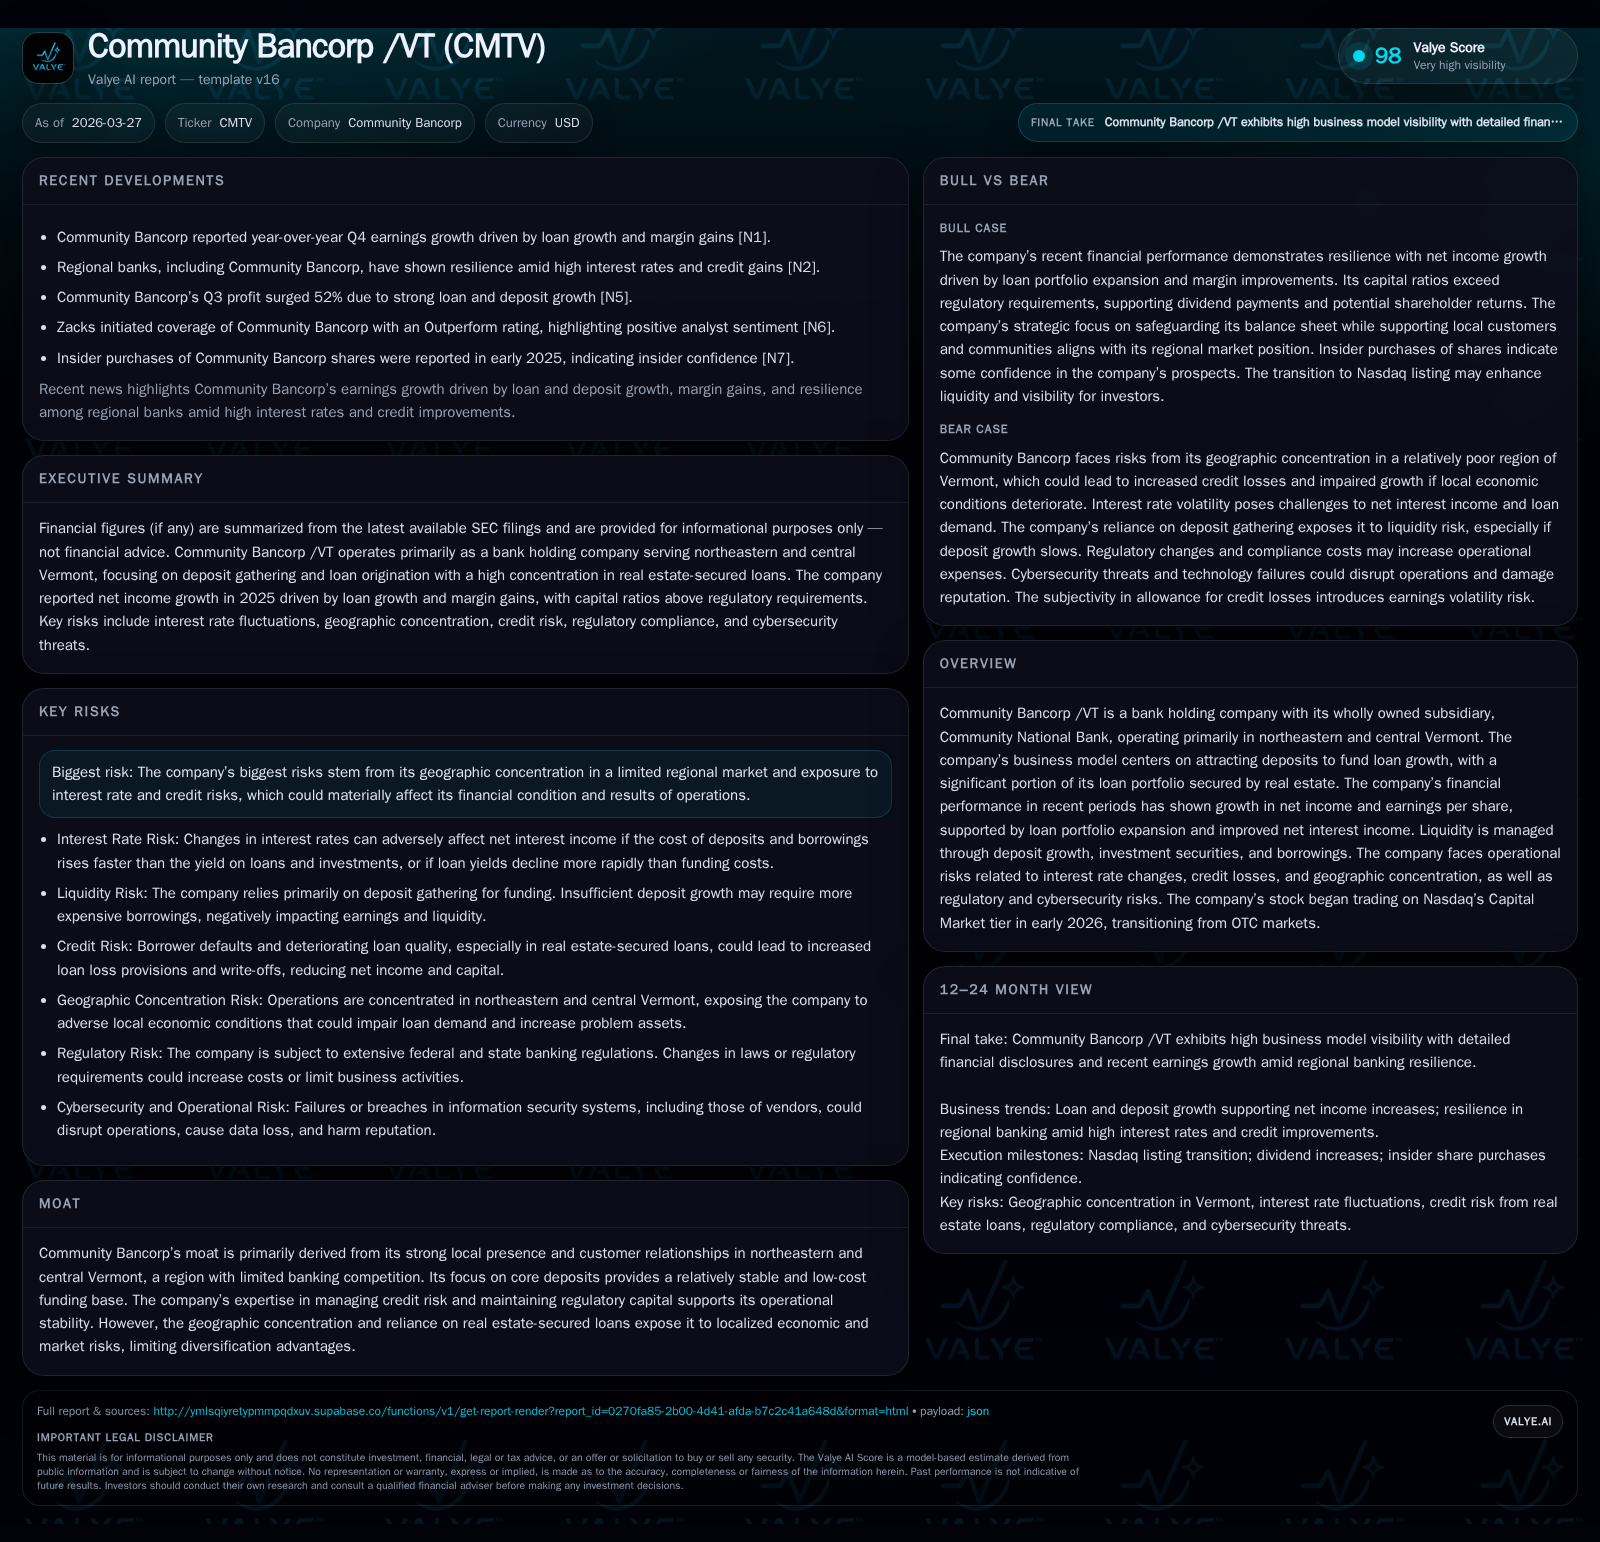
Community Bancorp /VT (CMTV) has demonstrated consistent growth in net income driven by loan portfolio expansion and improved net interest income. Its business model hinges on attracting deposits primarily within northeastern and central Vermont to fund predominantly real estate-backed loans, which both supports stable margins and concentrates regional risk. The company manages liquidity largely through deposit growth supplemented by brokered deposits and Federal Home Loan Bank advances. Going forward, loan demand, interest rate fluctuations, and deposit dynamics will shape performance, with capital deployment reflecting cautious buybacks and sustained dividends alongside regulatory compliance.
Introduction
Community Bancorp /VT operates primarily in northeastern and central Vermont through its sole banking subsidiary, Community National Bank. The company’s business revolves around securing customer deposits largely within its regional footprint to fund a growing loan portfolio heavily weighted toward real estate-secured loans. This geographic concentration defines both its competitive moat—strong local customer relationships—and its key operational risks.
Historical performance (annual)
| FY | Net ($mm) | CFO ($mm) | Capex ($) | Net YoY |
|---|---|---|---|---|
| 2025 | 17 | 16 | 780773 | +32.9% |
| 2024 | 13 | 16 | 791790 | -5.0% |
| 2023 | 13 | 15 | 633462 | -2.2% |
| 2022 | 14 | 16 | 615549 |
Source: SEC companyfacts cache [F1].
Capital returns and efficiency (annual)
| FY | Div ($mm) | FCF ($mm) | ROE% |
|---|---|---|---|
| 2025 | 4 | 15 | 14.9 |
| 2024 | 15 | 13.0 | |
| 2023 | 4 | 14 | 15.1 |
| 2022 | 15 | 18.3 |
Source: SEC companyfacts cache [F1].
Historical Performance and Growth Drivers
Community Bancorp delivered solid financial results in FY2025 with net income rising approximately 32.9% from $12.8 million in FY2024 to $17.0 million [F1]. This improvement was supported by a loan portfolio increase of about 3.7%, reaching nearly $962 million as of September 30, 2025 [F1][S2], concentrated mainly in commercial real estate (CRE), residential first-lien mortgages, and junior lien home equity loans [S9][S16].
Residential mortgage loans represent roughly 28% of the portfolio, focusing on traditional fixed-rate products without high-risk features such as interest-only or high loan-to-value options [S8]. CRE loans are diversified within Vermont but concentrated regionally, reflecting management's experience in underwriting and monitoring credit quality through independent reviews and conservative policies [S8][S11].
Deposit growth was modest year-to-date through September 2025 with total deposits slightly increasing by approximately $6.7 million (0.7%) to just over $1 billion. Increases were primarily in time deposits (+17%), supported by brokered deposits that stabilize funding when core deposit growth lags loan demand [S10][S12]. Conversely, transaction accounts including money market funds declined due to competitive pressures or customer behavior changes [S12].
Liquidity and Capital Structure
Liquidity is managed carefully given the company's reliance on core deposit gathering within a limited market area. Reciprocal brokered deposits via CDARS/ICS programs totaled $4.5 million as of Q3 2025 along with brokered time deposits approximating $36.6 million [S4][S12].
Federal Home Loan Bank (FHLB) borrowings secured by qualifying loans provided additional liquidity capacity with outstanding advances around $46.3 million against available lines near $136 million at late Q3 2025 [S4][S12]. No borrowings were outstanding on the unsecured correspondent bank line of credit at those dates [S5].
Capital levels remain robust with common equity tier 1 capital ratios exceeding 12.5%, well above regulatory minimums for prompt corrective action requirements [S23]. Shareholders’ equity grew to approximately $114 million by end-2025 from about $98 million at end-2024 [F1], reflecting retained earnings and disciplined capital management.
Net Interest Income and Margin Expansion
Net interest income rose significantly due to loan volume growth and favorable asset repricing amid rising rates, with an increase of roughly 11.9% for the first nine months of 2025 compared to prior year periods [S17]. Net interest margin expanded to approximately 3.64% for FY2025 compared to about 3.25% previously [F1][S18]. The Asset Liability Committee actively manages interest rate risk using scenario analyses incorporating parallel and non-parallel yield curve shifts [S24].
However, margin pressure exists from elevated deposit pricing necessary to retain funding amid monetary tightening which could compress margins if deposit costs rise faster than loan yields.
Credit Risk Management
Credit risk remains a key focus given concentration in CRE and residential lending within Vermont [S1]. Conservative underwriting excludes high-risk mortgage products; most residential mortgages over 80% loan-to-value are covered by PMI except select well-qualified borrowers [S8].
Allowance for credit losses is maintained under CECL guidelines combining quantitative models with management judgment factoring local economic conditions and collateral values regularly reviewed independently [S27]. Nonperforming assets are controlled via early borrower engagement.
Operating Efficiency
Expenses reflect investments in technology infrastructure aligned with geographic reach expansion without compromising cost control; consultant services support projects while ATM/debit card costs correlate with transaction volumes during periods of higher customer activity [S20].
Returns Profile and Capital Deployment
Return on equity based on FY2025 figures is approximately 14.9%, indicating effective profitability relative to shareholder capital [F1]. Operating cash flow was about $16 million in FY2025 with free cash flow after capex near $15 million supporting reinvestment or distributions.
Dividends paid totaled nearly $4 million in FY2025 with quarterly payouts maintained at $0.25 per share as declared March 2026; share repurchases continue under authorization but represent a smaller portion of capital return reflecting prudent balance sheet management [F1][S3][S7].
Outlook and Risks
Growth prospects include continued CRE lending expansion supported by regional economic activity; however, trade policy uncertainties between the U.S. and Canada pose macro risks given Vermont’s trade exposure [S14]. Residential mortgage demand should remain stable without excessive credit risk buildup.
Future performance depends on maintaining core deposit inflows amid competition; brokered time deposits increase funding cost but provide flexibility when needed.
Interest rate volatility presents upside potential via higher yields but downside risk via increased funding costs that could compress margins despite asset repricing benefits.
Regulatory requirements will continue influencing capital allocation decisions while operational risks such as cybersecurity threats require ongoing vigilance.
What To Watch
- Deposit mix trends especially shifts between core versus brokered time deposits affecting funding costs.
- Loan portfolio quality metrics focusing on nonperforming assets within CRE segments.
- Net interest margin trajectory amidst evolving Federal Reserve policies post-2026.
- Regulatory developments impacting capital buffers or liquidity measures for regional banks.
- Execution of share repurchase programs versus dividend payments indicating capital usage priorities.
Conclusion
Community Bancorp /VT maintains a defensible niche anchored in Vermont’s relationship-driven banking model emphasizing conservative real estate lending practices. Steady earnings growth supported by disciplined asset/liability management positions it well despite inherent risks tied to geographic concentration and interest rate fluctuations.
Balancing funding costs against asset yield optimization alongside vigilant credit quality monitoring amid macroeconomic uncertainties will be critical for sustained profitability complemented by thoughtful capital stewardship including dividends and measured buybacks.
This analysis is provided solely for informational purposes without investment recommendations.
Disclaimer: This is research-only, informational analysis and not investment advice. It may include AI-generated interpretation and general industry context. Always verify important details using primary sources.
Comments