
Manhattan Bridge Capital’s Steady Niche Amid Shifting Real Estate Finance Dynamics
Focused underwriting and a regional loan portfolio underpin Manhattan Bridge Capital’s resilient performance in a competitive real estate lending market.
Manhattan Bridge Capital, operating as a REIT, maintains a distinctive position in the specialized hard money lending sector focused on the New York metropolitan area and Florida. Despite a modest revenue contraction in FY2025, the company demonstrates disciplined underwriting and stable returns with an approximate ROE near 12%. Its strategic use of credit lines supports lending activities while restrictive covenants impose growth constraints. Key risks include borrower concentration and financing limitations, which management addresses through rigorous due diligence and loan structuring tailored to small developers.
Evolution of Lending Performance: Trends and Turning Points
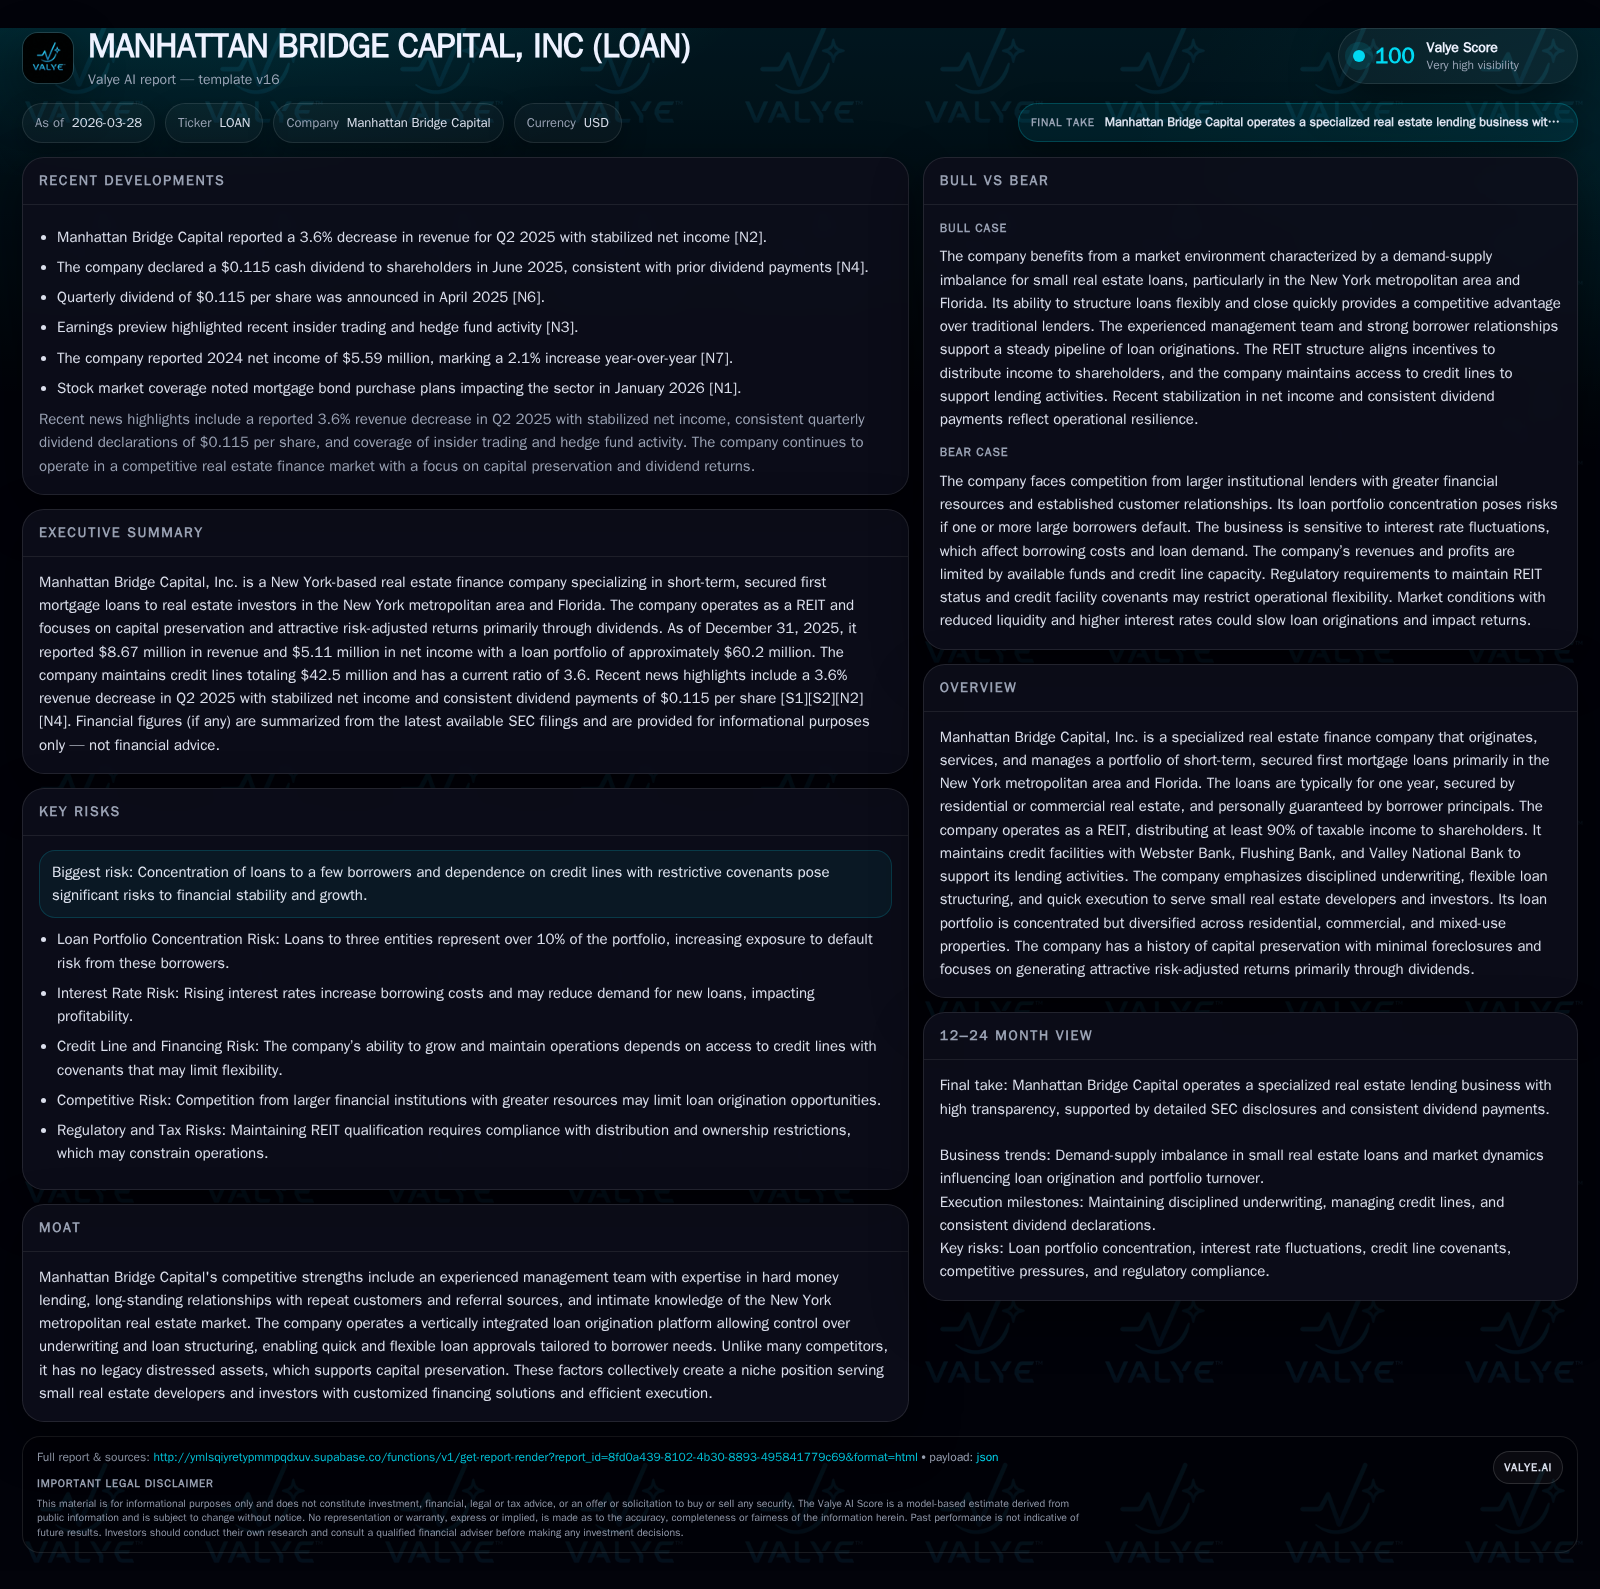
Manhattan Bridge Capital, Inc. (ticker: LOAN) reported $8.67 million in revenue for fiscal year 2025, marking a contraction of roughly 10.6% compared to $9.69 million in 2024 [F1]. The decline traces directly to softer loan origination volumes during a challenging real estate finance environment characterized by elevated interest rates. Concurrently, operating income decreased 8.6% to approximately $5.09 million, indicating preserved operational efficiency despite top-line pressures.
Net income followed suit at $5.11 million (down 8.6%), reflecting consistent control over credit losses and expense management. Notably, operating cash flow remained largely stable ($4.93 million in FY2025 vs $4.93 million prior year), underlining steady cash conversion despite revenue headwinds [F1]. Capital expenditures plummeted sharply (~89.6% YOY), underscoring the company's focused approach on core lending operations rather than capital investments.
The company’s return on equity rests near an implied 11.9%, balancing profitability against an equity base exceeding $43 million [F1]. This signals a resilient underwriting approach coupled with conservative leverage usage, mitigating earnings volatility during cyclical market shifts.
Historical performance (annual)
| FY | Rev ($mm) | Net ($mm) | CFO ($mm) | OpInc ($mm) | Rev YoY | Net YoY |
|---|---|---|---|---|---|---|
| 2025 | 9 | 5 | 5 | 5 | -10.6% | -8.6% |
| 2024 | 10 | 6 | 5 | 6 | -1.1% | +2.1% |
| 2023 | 10 | 5 | 6 | 5 | +14.3% | +5.1% |
| 2022 | 9 | 5 | 5 | 5 |
Source: SEC companyfacts cache [F1].
Capital returns and efficiency (annual)
| FY | Div ($mm) | FCF ($mm) | ROE% |
|---|---|---|---|
| 2025 | 5 | 5 | 11.9 |
| 2024 | 5 | 5 | 12.9 |
| 2023 | 5 | 6 | 12.8 |
| 2022 | 6 | 5 | 12.2 |
Source: SEC companyfacts cache [F1].
Financials reflect measured contraction amidst market tightening with maintained profitability margins [F1].
Strategic Positioning: Carving a Niche in New York Metropolitan and Florida Markets
LOAN primarily serves small real estate developers through specialized short-term mortgage loans secured by first mortgage liens on residential and commercial properties predominantly located within the New York metro area—including New Jersey and Connecticut—as well as expanding activities in Florida [S1][S4]. These loans typically have one-year terms and are personally guaranteed by borrower principals [S1].
The company's underwriting rigor is reflected in extensive creditworthiness assessments combining property valuations (including neighborhood liquidity analysis) with scrutiny of borrower principals through third-party credit reports and financial documentation [S1]. Vertical integration across origination to servicing allows LOAN to swiftly tailor loan structures such as adjustable interest rate clauses ensuring minimum spreads above prime rates [S16].
This nimble approach distinguishes LOAN from institutional REITs or banks that often lack such flexibility or speed as they serve larger borrowers or require longer approval cycles [S4]. Additionally, LOAN enforces loan size caps at approximately $3.6 million or less than ~10% of aggregate portfolio exposure per individual loan to maintain portfolio diversification and control concentration risks [S1][S9].
Competition and Market Dynamics: Defending Against Institutional Giants
Competition stems from various institutional lenders such as banks, specialty finance companies, mortgage REITs, hedge funds, family offices and high net worth individuals possessing greater scale and capital access [S4][S11]. Many competitors benefit from lower funding costs or government program access unavailable to LOAN.
However, recent interest rate hikes have caused liquidity withdrawal and dampened competition across real estate finance segments—a dynamic offering LOAN relative relief [S4][S16]. Higher funding rates inevitably raise costs for all lenders but LOAN's conservative debt-to-equity ratio and focus on smaller developers buffered against intense price competition such institutions might provoke.
Indeed the 'hard money lending' sector—characterized by short-duration loans backed by tangible collateral—entails elevated risk-return tradeoffs requiring specialized underwriting acumen where Manhattan Bridge Capital's management has entrenched experience [S25]. This expertise continues to be an essential competitive moat amid ongoing consolidation among larger players.
Capital Structure, Credit Facilities and Liquidity Landscape
LOAN utilizes two key credit facilities totaling $42.5 million pivotal for funding its loan originations: a $32.5 million line from Webster Bank and Flushing Bank expiring February 28, 2029; plus a $10 million facility from Valley National Bank maturing December 12, 2027 [S5][S6][S7].
As of December 31, 2025 LOAN had approximately $17.6 million drawn under these lines with aggregate assets totaling $62.35 million—dominated by mortgage loans net of deferred fees ($60.2 million) [S7]. Interest expenses rise alongside SOFR-plus premium pricing averaging around mid-to-high single digits percent reflective of current tightening monetary policy.
These facilities contain customary covenants limiting borrowing relative to collateral valuation thresholds as well as restrictions on dividend payments when certain financial targets are missed [S6][S10]. They also constrain common share repurchases capped at roughly ten percent of prior-year net income and place limits on repurchase/redemption activity overall.
Strong liquidity discipline plus cash reserves contribute an additional buffer though the illiquidity inherent in the mortgage loan portfolio imposes constraints on rapid asset liquidation without loss [S14][S15]. The cross-default provisions linking debt obligations amplify refinancing risks should covenant breaches arise.
Dividend Policy and Returns Generation in a REIT Framework
Operating as a REIT since at least tax year ended December 31, 2014,[S1] Manhattan Bridge Capital distributes at least ninety percent of taxable income annually to shareholders as dividends to maintain favorable tax treatment under U.S federal law.
FY2025 saw dividends paid totaling approximately $5.26 million—consistent with prior years patterns—and underscores the company’s intent to balance shareholder payout mandates while preserving capital internal to meet lending needs [F1].
ROE hovering around twelve percent combined with sustainable net income affirms the firm’s capacity to generate returns aligned with its risk appetite within this hard-money niche emphasizing capital preservation alongside yield generation.
Forward-Looking Indicators: What to Watch in LOAN’s Loan Portfolio and Loan Renewal Rates
Key metrics warranting close observation include geographic concentrations—with over ninety-three percent of loans anchored in NY metro property markets facing varied economic fundamentals—and property-type mix tilted heavily toward residential mortgages generating approximately eighty-six percent of interest income [S8][S9].
Similarly critical is the renewal trajectory for short-term loans typically bearing one-year maturities but routinely extended via agreements reflecting continued borrower viability versus extension risk that could strain liquidity buffers if prolonged excessively [S20].
Loan delinquency trends combined with maintenance of required borrower guarantees constitute essential forward indicators given noted concentration risks where three related entities represent over ten percent of the loan book aggregated exposure [S8][S21]. Management's robust due diligence protocols mitigate these risks albeit cannot eliminate systemic real estate downturn effects.
Risks from Concentration and Financing Covenants: Managing Tight Constraints
LOAN identifies significant risk stemming from both concentrated exposure to few borrowers—with one individual owning majority stakes across three entities totaling more than ten percent of loans—and restrictive covenant frameworks embedded within its credit lines [S12][S17][S21][S27]. Defaults concentrated among affiliated borrowers could trigger multi-faceted adverse impacts ranging from revenue erosion through increased allowances for credit losses up to forced asset liquidations required for debt service compliance [S21][S24].
Moreover compliance with leverage-related covenants governs not only borrowing capacity but also influences dividend payment ability—a direct constraint on capital allocation flexibility essential for scaling operations or weathering recessions [S12][S17][S23]. This heightens liquidity management imperatives under volatile real estate cycles.
Mitigating factors include management’s seasoned judgment authority empowered under board controls facilitating disciplined lending decisions constrained within exposure caps per loan; extensive collateral assessments including title searches; and personal guarantees enhancing recovery potential upon default events [S25]. The firm also benefits from no legacy distressed assets currently impairing balance sheet integrity—a notable competitive advantage compared to some peers.
Nonetheless tight coupling between portfolio performance volatility and financing covenant adherence delineates an inherently delicate balance necessitating vigilant monitoring moving forward.
This report synthesizes information exclusively from official SEC filings ([F1], [S#]) without projection beyond stated facts or speculative guidance absent explicit disclosures. It aims to provide a balanced internal analytical perspective on Manhattan Bridge Capital's historical performance dynamics; strategic posture within its specialized financing niche; financial structure robustness including liquidity considerations within a REIT framework; as well as material operational risks linked to portfolio concentration and debt restrictions.
Disclaimer: This is research-only, informational analysis and not investment advice. It may include AI-generated interpretation and general industry context. Always verify important details using primary sources.
Comments