
Dillard's, Inc.: Evaluating Growth Slumps and Strategic Resilience in Retail
A focused review of Dillard’s earnings softness, private label moat, and disciplined capital use amidst sector challenges.
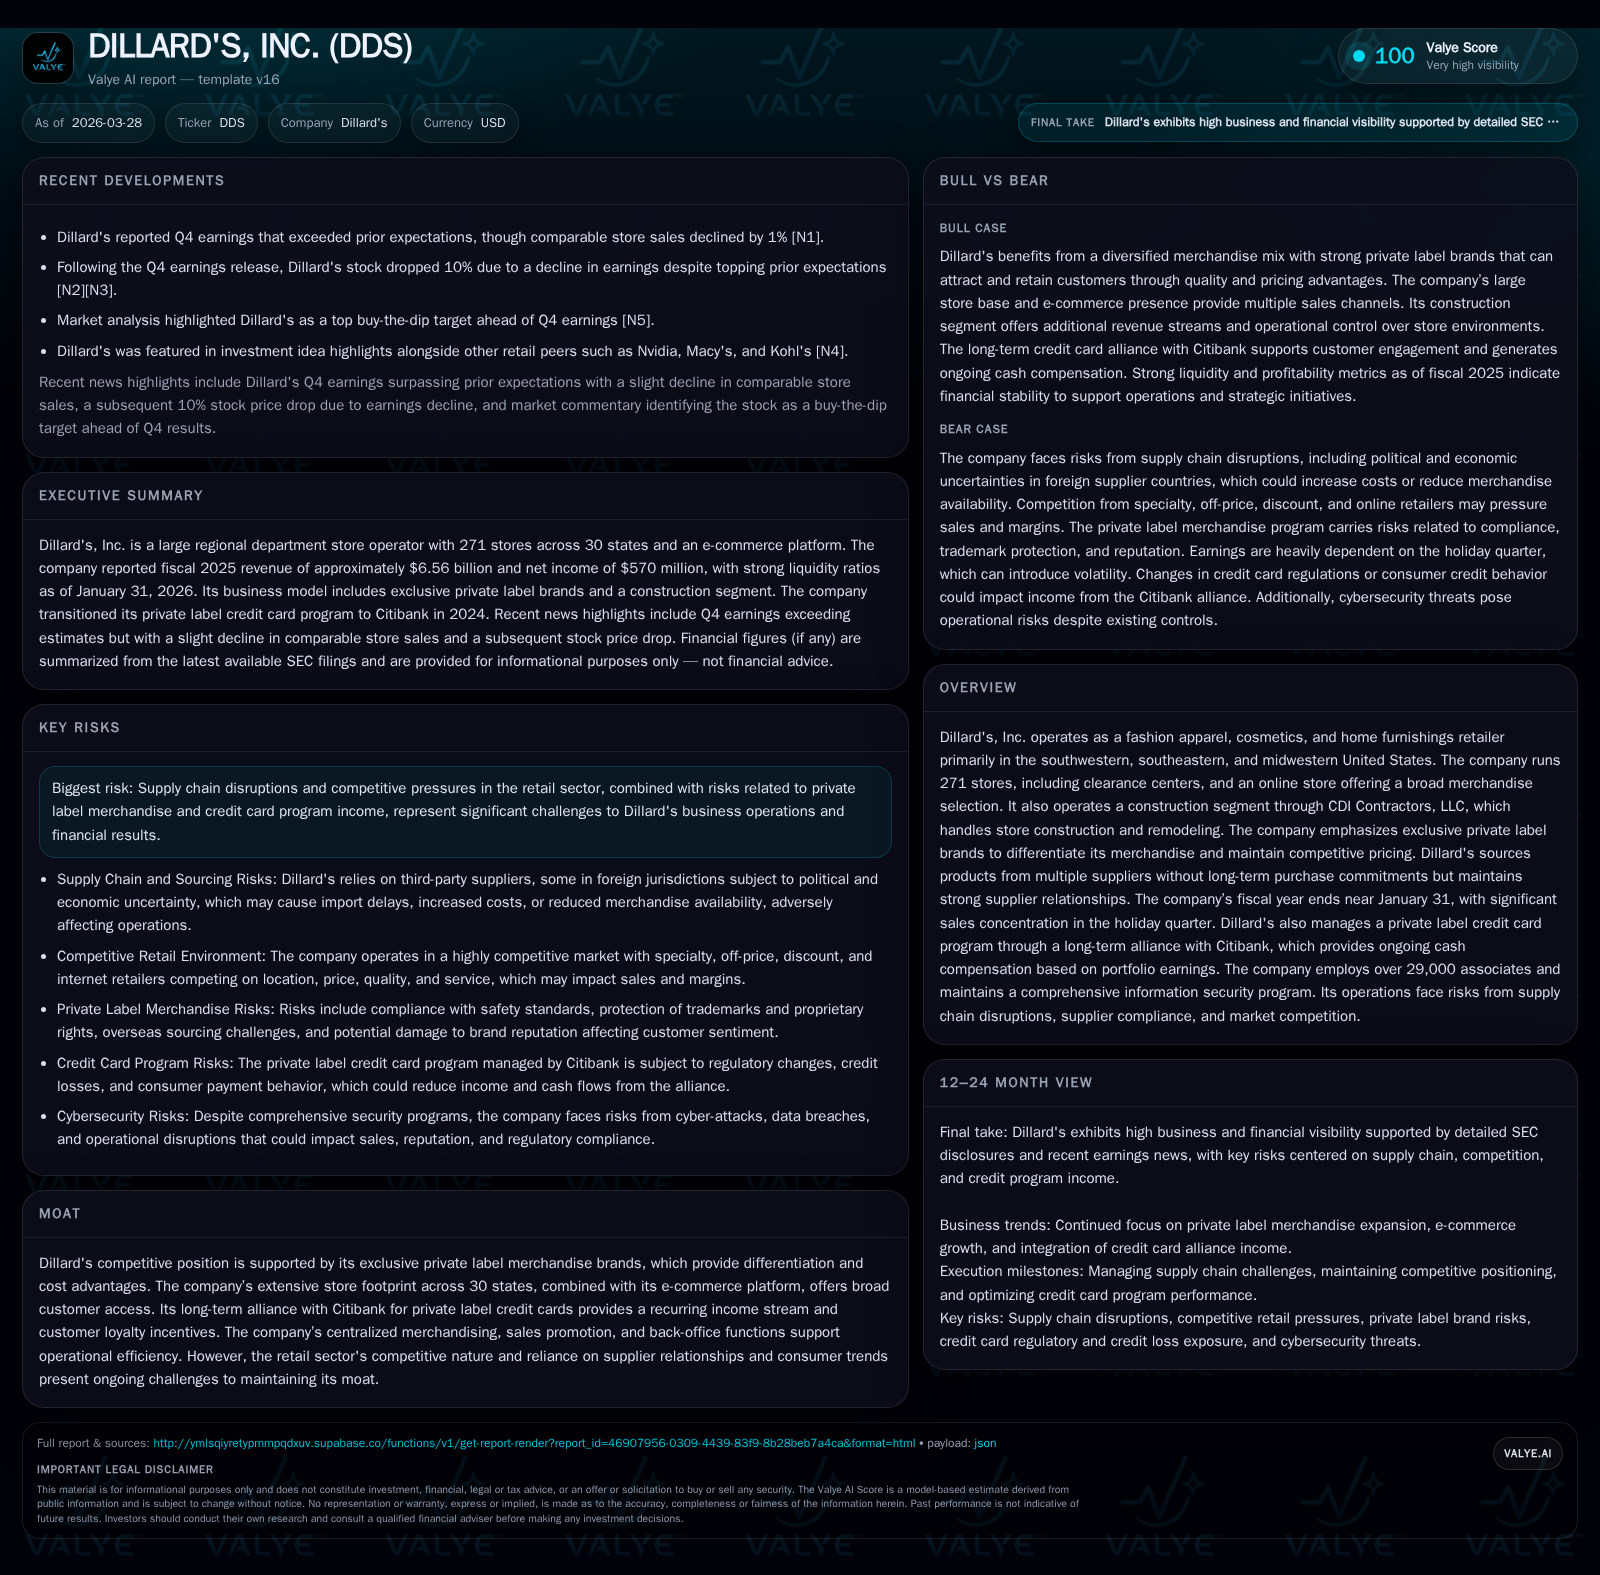
Dillard's reported a marginal revenue decline of 0.4% and a sharper net income decrease of 3.9% year-over-year for fiscal 2025, reflecting pressure on profitability despite stable cash flow generation. The company leverages its exclusive private label brands to differentiate merchandise and secure cost advantages, supporting competitive positioning across a broad regional store footprint complemented by an evolving omnichannel platform. Capital allocation remains prudent with strong return on equity near 32%, growing dividends, moderated share repurchases, and reduced capex signaling operational efficiency. Key challenges include intensifying competition, supply chain disruptions, seasonality impact, and dependency on the Citibank credit card alliance for income streams.
Recent Financial Trends and Performance Dynamics
Dillard’s recent financial performance is characterized by a slight contraction in top-line revenue juxtaposed against a more pronounced decline in net income. For fiscal year ending January 31, 2026 (FY2025), revenue edged down by approximately 0.4% to $6.56 billion from $6.59 billion in FY2024, while net income decreased by nearly 3.9% to $570 million compared to $593 million the prior year [F1]. Operating cash flow exhibited resilience during this period at about $717 million, essentially flat year-over-year, allowing the company to generate healthy free cash flow after spending roughly $93 million on capital expenditures—down about 10.7% from FY2024 levels [F1].
The quarterly earnings pattern reflects the high seasonality inherent in Dillard’s business; roughly one-third of annual sales occur during the fiscal fourth quarter coinciding with holiday shopping [S6]. Despite this concentration posing volatility risks for quarterly results—including a noted comparable store sales decline of about 1% in Q4—the company beat earnings expectations for Q4 according to market reports [N1][N3]. This dynamic underscores the challenge retail operators face balancing peak-period reliance against more subdued consumer traffic or discretionary spend shifts during other quarters.
Historical performance (annual)
| FY | Rev ($bn) | Net ($mm) | CFO ($mm) | Capex ($mm) | Rev YoY | Net YoY |
|---|---|---|---|---|---|---|
| 2025 | 6.6 | 570 | 717 | 93 | -0.4% | -3.9% |
| 2024 | 6.6 | 593 | 714 | 105 | -4.1% | -19.7% |
| 2023 | 6.9 | 739 | 884 | 133 | -1.7% | -17.1% |
| 2022 | 7.0 | 892 | 948 | 120 |
Source: SEC companyfacts cache [F1].
Capital returns and efficiency (annual)
| FY | Div ($mm) | Buybacks ($mm) | FCF ($mm) |
|---|---|---|---|
| 2025 | 485 | 108 | 624 |
| 2024 | 414 | 121 | 610 |
| 2023 | 339 | 281 | 751 |
| 2022 | 271 | 453 | 828 |
Source: SEC companyfacts cache [F1].
Note: Fiscal years end near January each year; data per SEC filings compiled from [F1].
Private Label Differentiation: The Moat in Focus
Central to Dillard's competitive advantage is its exclusive portfolio of private label merchandise spanning brands such as Antonio Melani for womenswear and Gianni Bini among others [S5][S6]. These labels create differentiation that conventional department stores struggle to replicate due to proprietary designs and tighter control over sourcing and quality standards.
The private label strategy yields multiple benefits: it enforces higher quality consistent with Dillard’s brand positioning while enabling more effective price setting without direct comparison to national branded alternatives. This control extends beyond product features into supply chain flexibility since no long-term purchase commitments are required with vendors—allowing adaptive inventory management aligned with rapidly changing fashion trends [S5]. Moreover, investment in trademark protection guards intellectual property supporting sustained exclusivity.
By cultivating these private brand offerings alongside national brands across apparel categories—women’s apparel (20%), men’s apparel (19%), accessories (14%), shoes (14%), cosmetics (~16%)—the company fortifies its merchandising mix against commoditization pressures common in department store retailing sectors [S4][S5]. This approach also fosters customer loyalty by offering unique products not easily found elsewhere.
However, expanding private brands introduces risks related to overseas sourcing complexities including compliance with safety standards and reputational risks tied to supplier conduct abroad [S28]. Management acknowledges this increasing scope of responsibilities alongside ongoing investments in proprietary brand development.
Retail Footprint and Online Integration Strategy
Dillard’s operates an extensive network of physical locations—271 stores distributed primarily across the southwestern, southeastern and midwestern United States encompassing approximately 46 million square feet of retail space—with ownership accounting for around 43 million square feet while leased space constitutes the remainder [S6][S7]. Store placements focus heavily on shopping malls and open-air centers chosen for their traffic generation capability; cluster strategies emphasize alignment with anchor tenants and regional demographic profiles.
This brick-and-mortar base is buttressed by a robust online presence via dillards.com which serves both as an e-commerce channel and a digital engagement platform featuring fresh content tailored to style trends [S4]. The omnichannel capability includes flexible fulfillment options such as buy-online-pickup-in-store (BOPIS) or direct home delivery—crucial given evolving consumer expectations blending digital convenience with traditional retail experiences.
Centralized corporate functions support this footprint with headquarters managing merchandising decisions informed by regional offices leveraging store-level insights—a localized assortment strategy aiming at precise fit to local tastes across ~30 states served [S5][S6]. This operational model strives for efficiency gains alongside responsive inventory flow.
Competitive Pressures and Supply Chain Challenges
Despite these strengths Dillard's faces a complex competitive environment comprising traditional department stores alongside specialty chains, discount outlets and rapidly growing e-commerce disruptors [S6]. Each competitor vies across factors including location desirability, merchandise quality & assortment breadth, pricing aggressiveness and service quality—all intensified as online platforms lower entry barriers enabling price transparency.
Supply chain volatility compounds this landscape; recent global freight disruptions—port delays exacerbated by geopolitical tensions—and shifting trade policies like tariffs inject uncertainty impacting inventory availability costs and timing [S20][S27]. Moreover Dillard's construction segment employing cost-to-cost contract accounting is susceptible to profit fluctuations from contract revision adjustments adding earnings variability risk [S8].
Operationally managing these dynamics requires nimbleness: maintaining tight supplier relationships without binding long-term purchase obligations helps preserve flexibility but elevates risk exposure if suppliers falter unexpectedly or regulations shift abruptly.
Cybersecurity risks loom large as well given reliance on integrated IT systems spanning point-of-sale terminals through online order processing; breaches could disrupt operations or erode customer trust materially despite established mitigation programs outlined by management oversight committees [S7][S22][S24].
Capital Allocation and Shareholder Returns: A Closer Look
Dillard’s capital strategy focuses on balancing reinvestment needs with returning value to shareholders underpinned by robust profitability metrics. The company's approximate return on equity stood near an impressive 32.1% for FY2025 derived from the ratio of net income ($570 million) over equity ($1.78 billion) indicative of efficient capital use relative to shareholder funding despite recent income pressure points [F1].
Operating cash flows remained sturdy around $717 million facilitating free cash flow generation even after capital expenditures reduced circa eleven percent year-over-year to about $93 million—the lowest reported in four years reflecting improved capex discipline or potential store remodel cadence adjustments [F1].
Dividend payouts rose consistently supported by sound cash flow trends climbing from $271 million in FY2022 up to nearly $485 million in FY2025 demonstrating commitment to returning steady income streams which underpin shareholder value propositions alongside dividend growth orientation evident over multiple fiscal years [F1][S29].
Conversely share repurchases have moderated notably shrinking from high hundreds of millions earlier towards roughly $108 million most recently possibly reflecting strategic prudence prioritizing liquidity conservation amid sector uncertainties or stock valuation considerations.
Forward-Looking Risks and Growth Constraints
Looking ahead persistent risk factors cloud growth visibility for Dillard's despite its entrenched market presence. Consumer discretionary spending remains sensitive to macroeconomic headwinds including inflationary pressures affecting disposable incomes particularly in energy-centric regions where many stores are located creating geographic concentration risk exposures [S13].
Dependence on the Citibank alliance for management of its private-label credit cards represents both a recurring revenue stream opportunity and vulnerability due to external economic credit conditions regulatory shifts or consumer behavior changes influencing finance charge recoveries—uncertainties amplified by relatively recent transition from Wells Fargo partnership completed in September 2024 entailing integration execution risks alongside inherent portfolio performance dependencies [S11][S16][N2][N4].
High turnover rates typical within retail labor markets challenge workforce stability impacting operational consistency; cybersecurity threats remain ongoing concerns necessitating continuous investment while sector-wide digital disruption pressures require accelerated innovation adoption lest market share erosion ensue [S8][N2].
Key Metrics to Monitor: Indicators for Investors
Monitoring comparable store sales trends relative to broader retail peer cohorts will provide timely signals regarding underlying consumer demand strength or softness crucial given that overall revenue changes have been incremental amidst margin contraction recently observed [N10]. Tracking progress within the Citibank credit card portfolio usage metrics including account growth balances carried payment rates and rewards program costs will shed light on future alliance income streams which represent material non-merchandise revenue sources.
Additionally holiday quarter sales outcomes remain pivotal owing to disproportionate revenue contribution signifying whether promotional initiatives successfully drive customer footfall or digital conversion—areas increasingly critical amidst proliferating omnichannel competition dynamics.
Conclusion: Balancing Tradition and Innovation
Dillard's currently confronts the dual challenges of softening earnings amid fierce retail competition while leveraging structural advantages anchored in exclusive private label brands that reinforce merchandise differentiation and cost positioning advantages. Coupled with a substantial owned physical footprint augmented by expanding e-commerce capabilities the company maintains avenues for resilient market access.
Capital allocation exhibits discipline highlighted through sustainable dividend hikes paired with moderated buybacks ensuring balance sheet strength conducive for opportunistic investments as sector headwinds unfold.
Nonetheless risk vectors encompassing supply chain interruptions geopolitical complexities labor market variability plus dependency on credit card alliance revenues temper growth outlooks requiring vigilant management focus and adaptive strategies blending legacy strengths with emergent retail innovation imperatives going forward.
This analysis is based solely on disclosed company filings and publicly available news reports as cited; it does not constitute investment advice or recommendations.
Disclaimer: This is research-only, informational analysis and not investment advice. It may include AI-generated interpretation and general industry context. Always verify important details using primary sources.
Comments