
Costco Wholesale Corp Boosts Membership Loyalty Amid Global Expansion
Q3 2026 results highlight Costco's robust membership renewal and international warehouse growth as key drivers sustaining top-line and cash flow momentum.
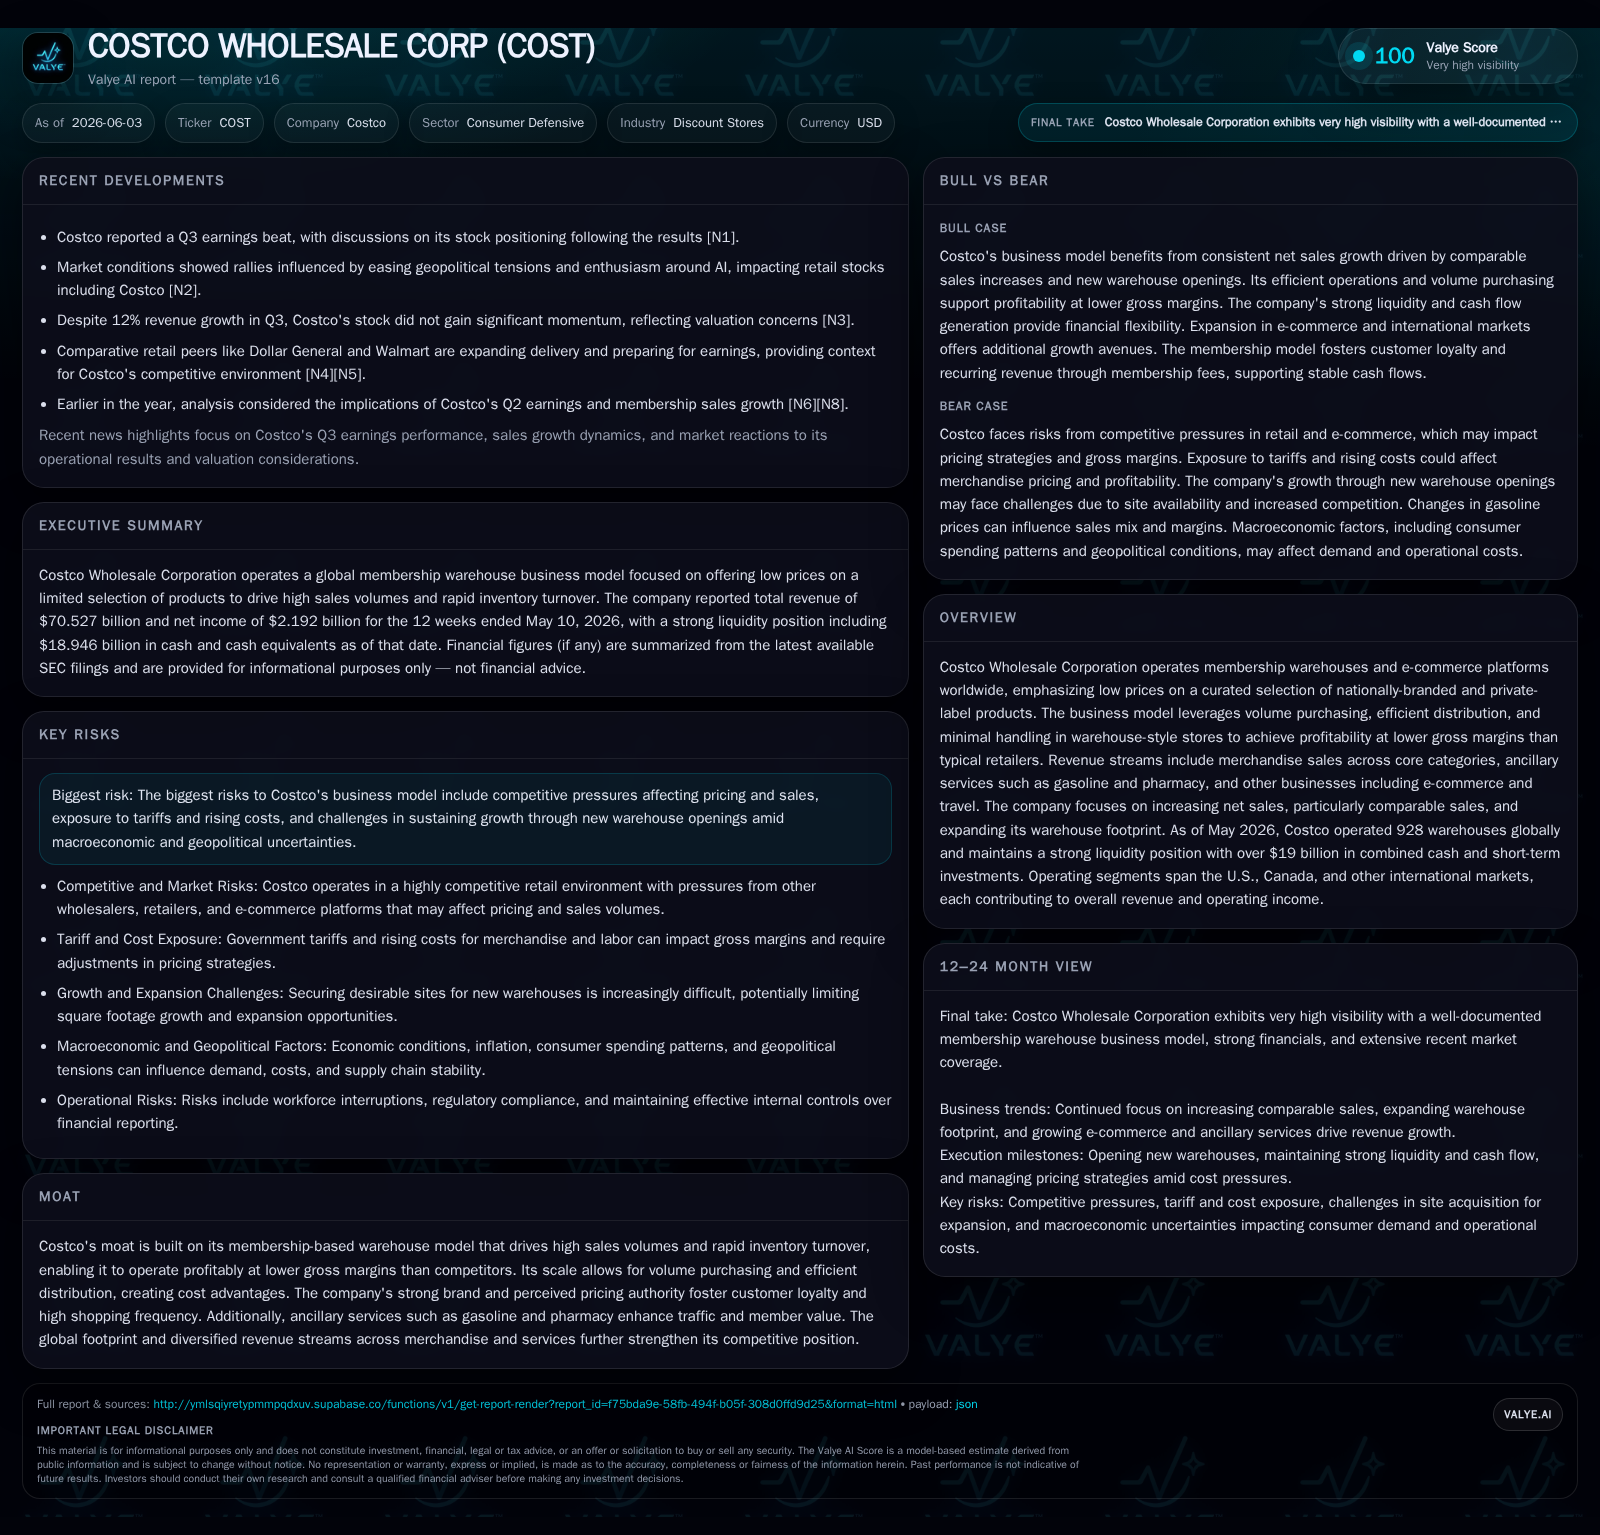
Costco’s Q3 2026 filing reveals continued strength in its membership-driven business model alongside accelerated global warehouse expansion. Despite the pressure of sales cannibalization in mature domestic markets, strong Executive membership penetration and near record-high renewal rates underpin recurring fee income. The company maintains a solid liquidity position supported by robust operating cash flows. While international footprint growth offers structural opportunity, margin expansion faces headwinds from competitive pricing and macroeconomic cost pressures.
Q3 Operating Update: Expansion and Member Momentum
Costco Wholesale Corporation’s latest quarterly filing dated June 3, 2026, underscores strategic progress anchored on dual growth pillars: expanding warehouse footprint internationally and deepening membership loyalty globally [S2]. The company reports that overall square footage growth is concentrated more heavily in foreign markets where the base remains smaller, facilitating faster expansion rates abroad versus domestic markets. However, this aggressive expansion carries the standard risk of cannibalization as new warehouses can pull sales from existing ones within overlapping geographies. Management explicitly notes that their membership model — central to sustained profitability — relies significantly on growing the member base, increasing penetration of the fee-enhanced Executive membership tier, and maintaining high renewal rates [S2]. These dynamics provide predictable recurring revenue streams that complement merchandise sales.
The quarter reflects continued positive traffic trends bolstered by ancillary offerings like gasoline stations and pharmacy services which serve as differentiators in customer value proposition. With comparable sales being a primary indicator of operational health, Costco’s ability to drive sustained growth at these mature locations signals steady consumer affinity for its curated assortment and value-driven pricing. Simultaneously, net cash provided by operating activities rose markedly year-over-year to $11.1 billion for the first thirty-six weeks ended May 10, 2026 — reflecting not only stronger top-line performance but also better inventory management leading to reduced net investment [S2]. These operational cash flows fund ongoing capital expenditures focused on further expanding capacity through new warehouse openings.
Costco’s Business Model: Membership-Driven Volume Advantage
At its core, Costco operates a membership warehouse club format that generates revenue primarily through two channels: recurring membership fees and high-volume merchandise sales facilitated by low gross margins [S1]. The membership fee component is structurally strategic — locking in customer loyalty while providing reliable fee income that supports lean pricing strategies against competitors. Product assortments blend nationally-recognized brands with Kirkland Signature private-label goods which command high turnover velocities underpinned by volume purchasing and distribution efficiencies. The no-frills warehouse design minimizes handling costs, enabling profitable operations at lower margin thresholds than traditional retail formats.
Ancillary services broaden Costco’s ecosystem with offerings like gasoline stations, pharmacies, optical centers, food courts, hearing aids, tire installation, e-commerce platforms, business centers, and travel services all contributing incremental revenue streams tied to increased member visits [S1]. The elevated penetration of Executive memberships — which carry a 2% reward program effectively subsidizing net sales allocations but enhancing lifetime customer value — indicates strong willingness among members to invest more for premium benefits. This multi-channel approach leverages digital enablement for e-commerce while preserving the primacy of physical warehouse experiences for bulk shopping needs.
Competitive Environment: Scale, Pricing Power, and Ancillary Services
Costco’s competitive moat arises from unmatched economies of scale in purchasing combined with a robust club membership barrier-to-entry model [S1]. The scale drives formidable vendor leverage allowing it much lower input costs relative to general mass merchandisers or club rivals such as Sam’s Club or BJ's Wholesale. Compared to these peers who may offer broader assortments but with thinner price leadership perceptions or less-developed ancillary businesses, Costco's focus on limited SKU selection combined with rapid inventory turnover sustains its reputation for pricing authority.
Its warehouse density across U.S., Canada and increasingly international geographies positions Costco as an omnipresent wholesale option with an established brand synonymous with value. Ancillary services integrated into warehouses boost foot traffic frequency and provide additional purchase incentives absent in many competitors’ models. This relentless focus on blending scale-driven sourcing advantages with attractive membership benefits creates enduring switching costs for customers seeking price-performance balance in bulk purchasing.
Growth Drivers: International Warehouse Expansion & Membership Penetration
International expansion is pivotal for Costco’s next phase of growth due to comparatively lower saturation levels outside North America [S2]. Markets in Asia-Pacific and Europe continue witnessing steady warehouse openings capturing incremental share amid rising middle-class affluence demanding value bulk shopping options. The company’s square footage growth rate abroad outpaces domestic expansions attributable to these greenfield opportunities.
Simultaneously, growing penetration of Executive memberships domestically elevates average revenue per member ratios fueled by their rewards program incentivizing larger basket sizes and repeated visits. E-commerce initiatives are evolving but remain complementary; physical warehouse relevance maintains primacy driven by customer preference for tactile bulk purchases alongside ancillary service access [S2,S3,S1]. Together these vectors cumulatively fuel profitability leverage which hinges critically on sustaining high renewal rates — which management highlights as integral to long-term earnings resilience.
Risks and Constraints: Sales Cannibalization and Macroeconomic Challenges
Despite structural strengths, operational tradeoffs persist notably the cannibalization impact when opening warehouses in existing markets where overlapping catchment areas temporarily dilute comparable sales performance at incumbent locations [S2]. Inflationary pressures elevate employee-related costs along with utilities and transportation expenses challenging margin expansions even as merchandising prices remain tightly controlled due to competitive intensity.
Tariff exposure on imported goods introduces volatility risks while geopolitical uncertainties could disrupt supply chain stability or dampen consumer confidence broadly impacting discretionary bulk spending. Legal contingencies linked to privacy claims or pharmaceutical litigation exist but so far have not posed material balance-sheet risks though must be monitored given their potential episodic effects [S10,S20,S22,S23,S27]. Managing these headwinds while executing aggressive physical growth and membership marketing requires scrupulous execution discipline.
What to Watch Next: Guidance Signals and Execution Milestones
Key forward-looking indicators include tracking upcoming warehouse opening cadence particularly outside North America where unit economics remain promising but nascent; shifts in Executive membership penetration rates which amplify fee income contribution; comparable or digitally-enabled comparable sales trajectories signaling underlying demand elasticity; margin progression amidst cost pressures; plus e-commerce channel developments providing cross-sell uplift without undue fulfillment cost creep [S2,S3]
Cash flow generation remains vital as it funds planned fiscal 2026 capital expenditures estimated around $6.5 billion directed principally towards new warehouses along with technology infrastructure upgrades supporting omni-channel synergy [S12,S2]. Management commentary within recent earnings supplements will likely illuminate how competitive dynamics shape promotional strategies or potential pricing adjustments.
Financial Position: Cash Flows, Liquidity, and Capital Deployment
Liquidity stands fortified by nearly $20 billion held collectively in cash equivalents and short-term investments complemented by moderate total debt levels approximating $5.7 billion — resulting in a net debt negative balance sheet estimated at -$13.3 billion as of May 10, 2026 [F1][S18]. Current ratio exceeding 1 suggests adequate short-term asset coverage over liabilities maintaining financial flexibility for both organic growth projects and opportunistic acquisitions or share repurchases if deemed prudent.
This analysis is based solely on information available from public filings including the latest quarterly SEC disclosures dated June 3, 2026 ([S2]), relevant annual filing ([S1]), recent event filings ([S3]), news reports (), and companyfacts data ([F1]). It should not be construed as investment advice or research view but rather as an objective examination of Costco Wholesale Corporation’s operating dynamics within the discount retail industry.
Financial position in context
As of 2026-05-10, companyfacts shows $18.9bn in cash and equivalents and $5.7bn of total debt [F1]. The same snapshot implies net debt of roughly $-13.3bn, keeping balance-sheet context relevant but secondary to the operating story [F1]. Current assets of $45.2bn and current liabilities of $42.1bn imply a current ratio near 1.07x for 2026-05-10 [F1].
Disclaimer: This is research-only, informational analysis and not investment advice. It may include AI-generated interpretation and general industry context. Always verify important details using primary sources.
Comments