
Comstock Resources Navigates Production Declines and Price Volatility with Strong Liquidity and Operational Expertise
Second-quarter 2026 results show lower production offset by stable pricing and robust liquidity backing growth plans.
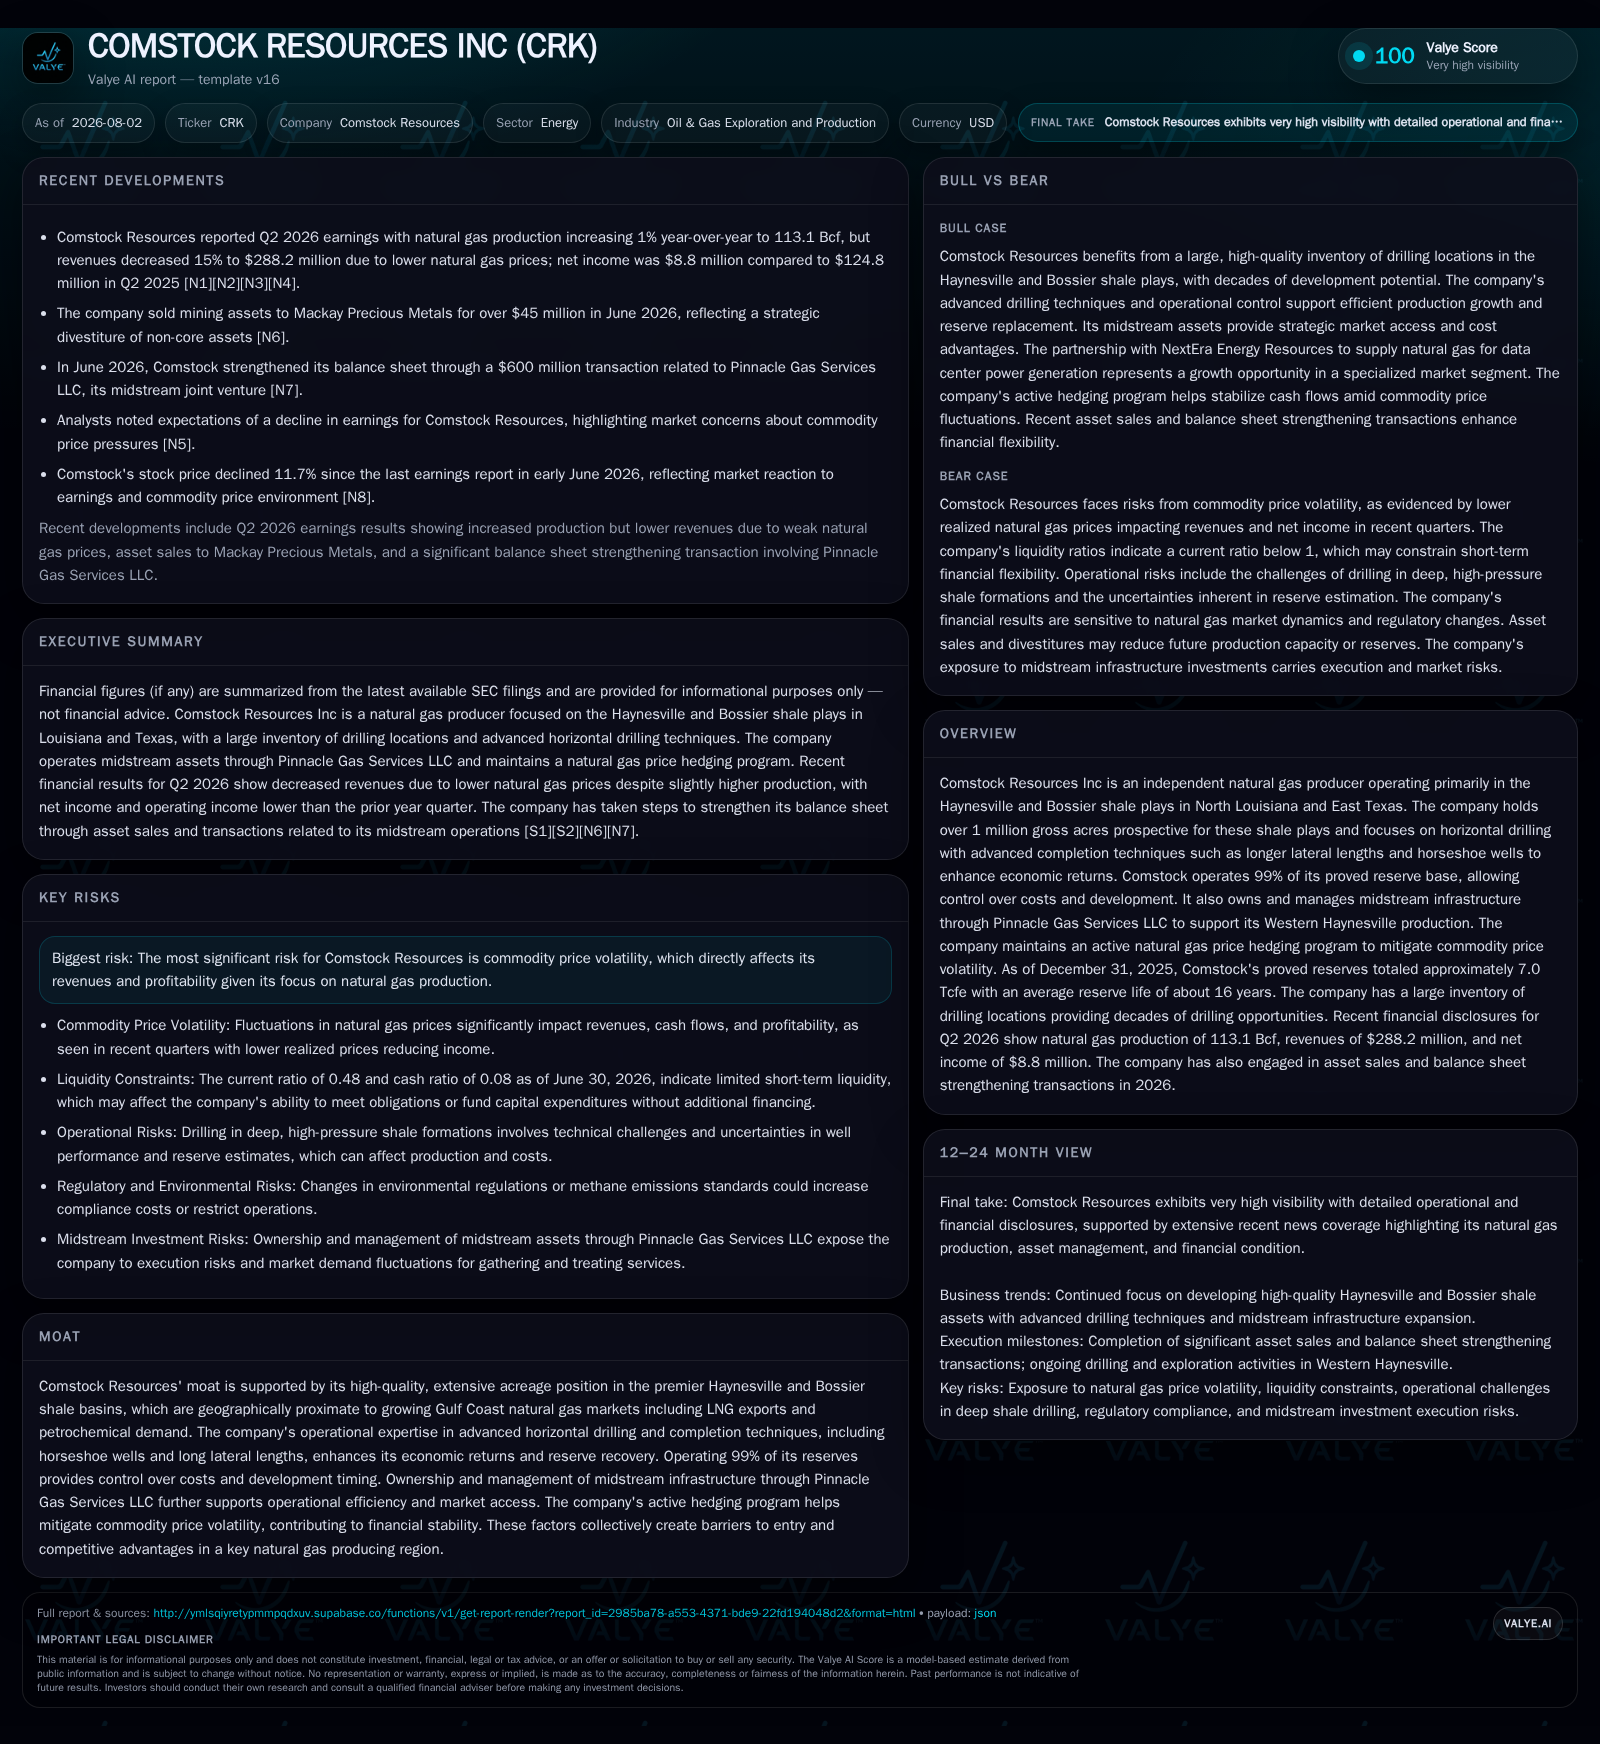
Comstock Resources reported a 7% decline in natural gas production for the first half of 2026 compared to 2025, with total natural gas and oil sales down 6%. Despite this, average realized prices remained largely stable, helped by an active hedging program. The company maintains over $1.2 billion in liquidity, supporting ongoing development in premier Haynesville and Bossier shale plays. Comstock’s operational strength lies in advanced horizontal drilling and midstream integration, though commodity price volatility remains a key risk. Upcoming capital expenditures and acreage expansion will be critical to sustaining reserve life and production growth.
Recent Operating Update: Production Decline Amid Stable Pricing and Strong Liquidity
Financially, Comstock maintains robust liquidity with $1.2 billion available as of June 30, including $45 million cash on hand and $1.1 billion of unused borrowing capacity under its bank credit facilities, with a portion ($150 million) earmarked for midstream activities [S2]. This financial flexibility underpins the company’s capacity to fund capital-intensive exploration, drilling, completion, midstream projects, and acquisitions without immediate refinancing concerns.
Operational investment remains significant; during the first half of 2026, Comstock drilled and completed approximately 34 Haynesville/Bossier wells (30.9 net) while projecting capital expenditures between $720 million and $820 million for the remainder of the year [S23]. Meanwhile, general and administrative expenses rose to $17.2 million in Q2 ’26 from $12.3 million in Q2 ’25, primarily driven by increased stock-based compensation alongside reduced overhead reimbursements following property divestitures completed in 2025 [S2]. These elevated costs may reflect strategic investments in talent retention aligned with long-term operational goals.
Business Model: Integrated Upstream Natural Gas Producer Leveraging Midstream Assets
Comstock’s core value proposition centers on upstream natural gas exploration, development, and production focused predominantly within the Haynesville and Bossier shale plays spanning North Louisiana and East Texas—a region known for its premium geology and proximity to Gulf Coast LNG export markets [S1]. At year-end 2025, Comstock held proved reserves near 7.0 Tcfe with roughly 99% operated interest across these assets and an average reserve life of approximately 16 years [S1].
Revenue generation is principally volume-driven via sales of produced natural gas under contracts priced largely on first-of-month index rates (70-75%) supplemented by daily spot market sales (25-30%), which introduces inherent price volatility but allows exposure to favorable spot pricing when available [S1]. The company mitigates this through an active hedging program that covers a meaningful portion of anticipated production.
Operational control is enhanced by direct operation of nearly all its producing properties, enabling efficient management of lease operating expenses, well completion timing, and capital deployment—key levers to maintain margins amid fluctuating commodity prices [S1]. Complementing upstream activities is Comstock’s ownership of Pinnacle Gas Services LLC (PGS), a midstream affiliate responsible for gathering, transportation, and processing infrastructure serving western Haynesville production [S1]. This vertical integration supports improved netback realization by reducing reliance on third-party pipeline tariffs and mitigating bottleneck risks.
Technologically, Comstock leverages horizontal drilling advancements including extended lateral lengths combined with patented horseshoe well designs—multiple well legs drilled from a single pad—to maximize reservoir contact per surface location while reducing per-unit costs [S1]. Such techniques enhance reserve recovery factors relative to conventional vertical wells employed by smaller or less integrated competitors.
Industry Positioning and Competitive Context
Within the independent natural gas exploration sector targeting U.S. shale basins—alongside peers such as EQT Corporation or Southwestern Energy—Comstock occupies a mid-tier position specializing geographically in Haynesville/Bossier formations recognized for comparatively low breakeven costs due to favorable geology and infrastructure proximity [S1]. Its scale is underscored by over one million acres held across these plays providing substantial drilling inventory relative to smaller independents.
Strategic location near Gulf Coast LNG export terminals provides structural demand support underpinning regional pricing even amid domestic market swings. Ownership of midstream assets via PGS further differentiates Comstock by enhancing logistical efficiency—a competitive advantage absent among some pure upstream players reliant on third-party infrastructure.
However, profitability remains closely tied to managing commodity price exposure; despite hedges smoothing cash flow volatility somewhat, price fluctuations continue to pose earnings risks typical within cyclic energy markets [S1]
Growth Drivers
Key drivers underpinning Comstock’s growth prospects include:
- Sustained global LNG demand growth benefiting Gulf Coast producers
- Continued technological improvements increasing per-well productivity through longer laterals and optimized stimulations
- Reserve replacement through consistent drilling across extensive acreage extending reserve life beyond current ~16 years
- Expansion of midstream capacity via Pinnacle Gas Services enabling volume growth without transport constraints
- Disciplined capital allocation aligning spend with prevailing market conditions
Encouraging early results from acreage extensions into Western Haynesville indicate potential for significant organic reserve base expansion beyond legacy zones [S1]. Planned capital expenditures exceeding $800 million annually signal management's commitment to executing staged growth while maintaining margin discipline.
Risks and Watchpoints
Principal risks include continued commodity price volatility impacting revenue stability despite hedging efforts [S1][S22], operational execution challenges such as drilling delays or suboptimal well performance affecting cost efficiency amidst capital intensity typical for hydraulic fracturing operations.
Environmental regulation presents uncertainty; Endangered Species Act protections could delay or increase costs related to development within sensitive habitat areas requiring mitigation measures [S1]. Compliance costs related to emissions controls or state-specific taxes may also pressure margins.
Financially, liquidity is strong at $1.2 billion as of June 30, 2026, including $45 million cash and $1.1 billion unused borrowing capacity under bank credit facilities, with $150 million restricted for midstream activities [S2]. The current ratio stands at approximately 0.48, reflecting working capital constraints typical for upstream operators [F1]. Total debt and net debt figures from December 31, 2025, were approximately $2.85 billion and $2.8 billion respectively [F1], indicating elevated leverage that requires sustained positive operating cash flow to meet debt servicing obligations.
Macroeconomic factors such as rising interest rates could elevate borrowing costs or restrict capital market access potentially complicating acquisition or capital project financing if external conditions deteriorate.
What To Watch Next
Investors should monitor:
- Second-half drilling productivity outcomes relative to planned capital deployment
- Realized pricing trends amid seasonal demand shifts
- Progress on midstream infrastructure expansion through Pinnacle Gas Services
- Operating cost metrics including lease operating expenses per Mcfe signaling efficiency changes
- Updates on hedge book composition reflecting management’s risk mitigation stance
- Any announcements regarding acreage acquisitions or portfolio optimization efforts
- Regulatory developments impacting environmental compliance timelines or costs [S2][S23][N1][N3]
These indicators will clarify whether recent production declines are transient operational pacing adjustments or indicative of deeper reservoir depletion requiring strategic recalibration.
Financial Profile Discussion
Comstock Resources maintains liquidity of approximately $1.2 billion as of June 30, 2026, consisting of $45 million in cash and cash equivalents and $1.1 billion of unused borrowing capacity under its bank credit facilities, with $150 million restricted for midstream activities [S2]. The current ratio is about 0.48, reflecting typical working capital constraints for upstream operators [F1]. Total debt and net debt figures from December 31, 2025, were approximately $2.85 billion and $2.8 billion respectively [F1].
Capital expenditure commitments remain sizeable with expected spending between $700 million and $820 million in H2’26 focused on development including exploration mainly within Western Haynesville expansions [S23]. Funding these outlays depends on disciplined working capital controls supported by predictable operating cash flows tempered by realized prices.
Overall, Comstock’s financial position provides operational stability assuming steady commodity prices while execution on converting drilled locations into producing wells will be pivotal for restoring upward production trends supporting EBITDA recovery.
This analysis is based solely on filings through July 30, 2026 ([S1], [S2], [S3]) complemented by recent market commentary ([N1], [N3]). It is intended exclusively for informational purposes without investment research views.
Disclaimer: This is research-only, informational analysis and not investment advice. It may include AI-generated interpretation and general industry context. Always verify important details using primary sources.

Comments