
Insperity’s Q2 2026 Growth Highlights PEO Scale and Margin Pressures from Benefits Inflation
Strong WSEE growth and revenue gains in Q2 underline Insperity's market reach despite cost headwinds and regulatory risks.
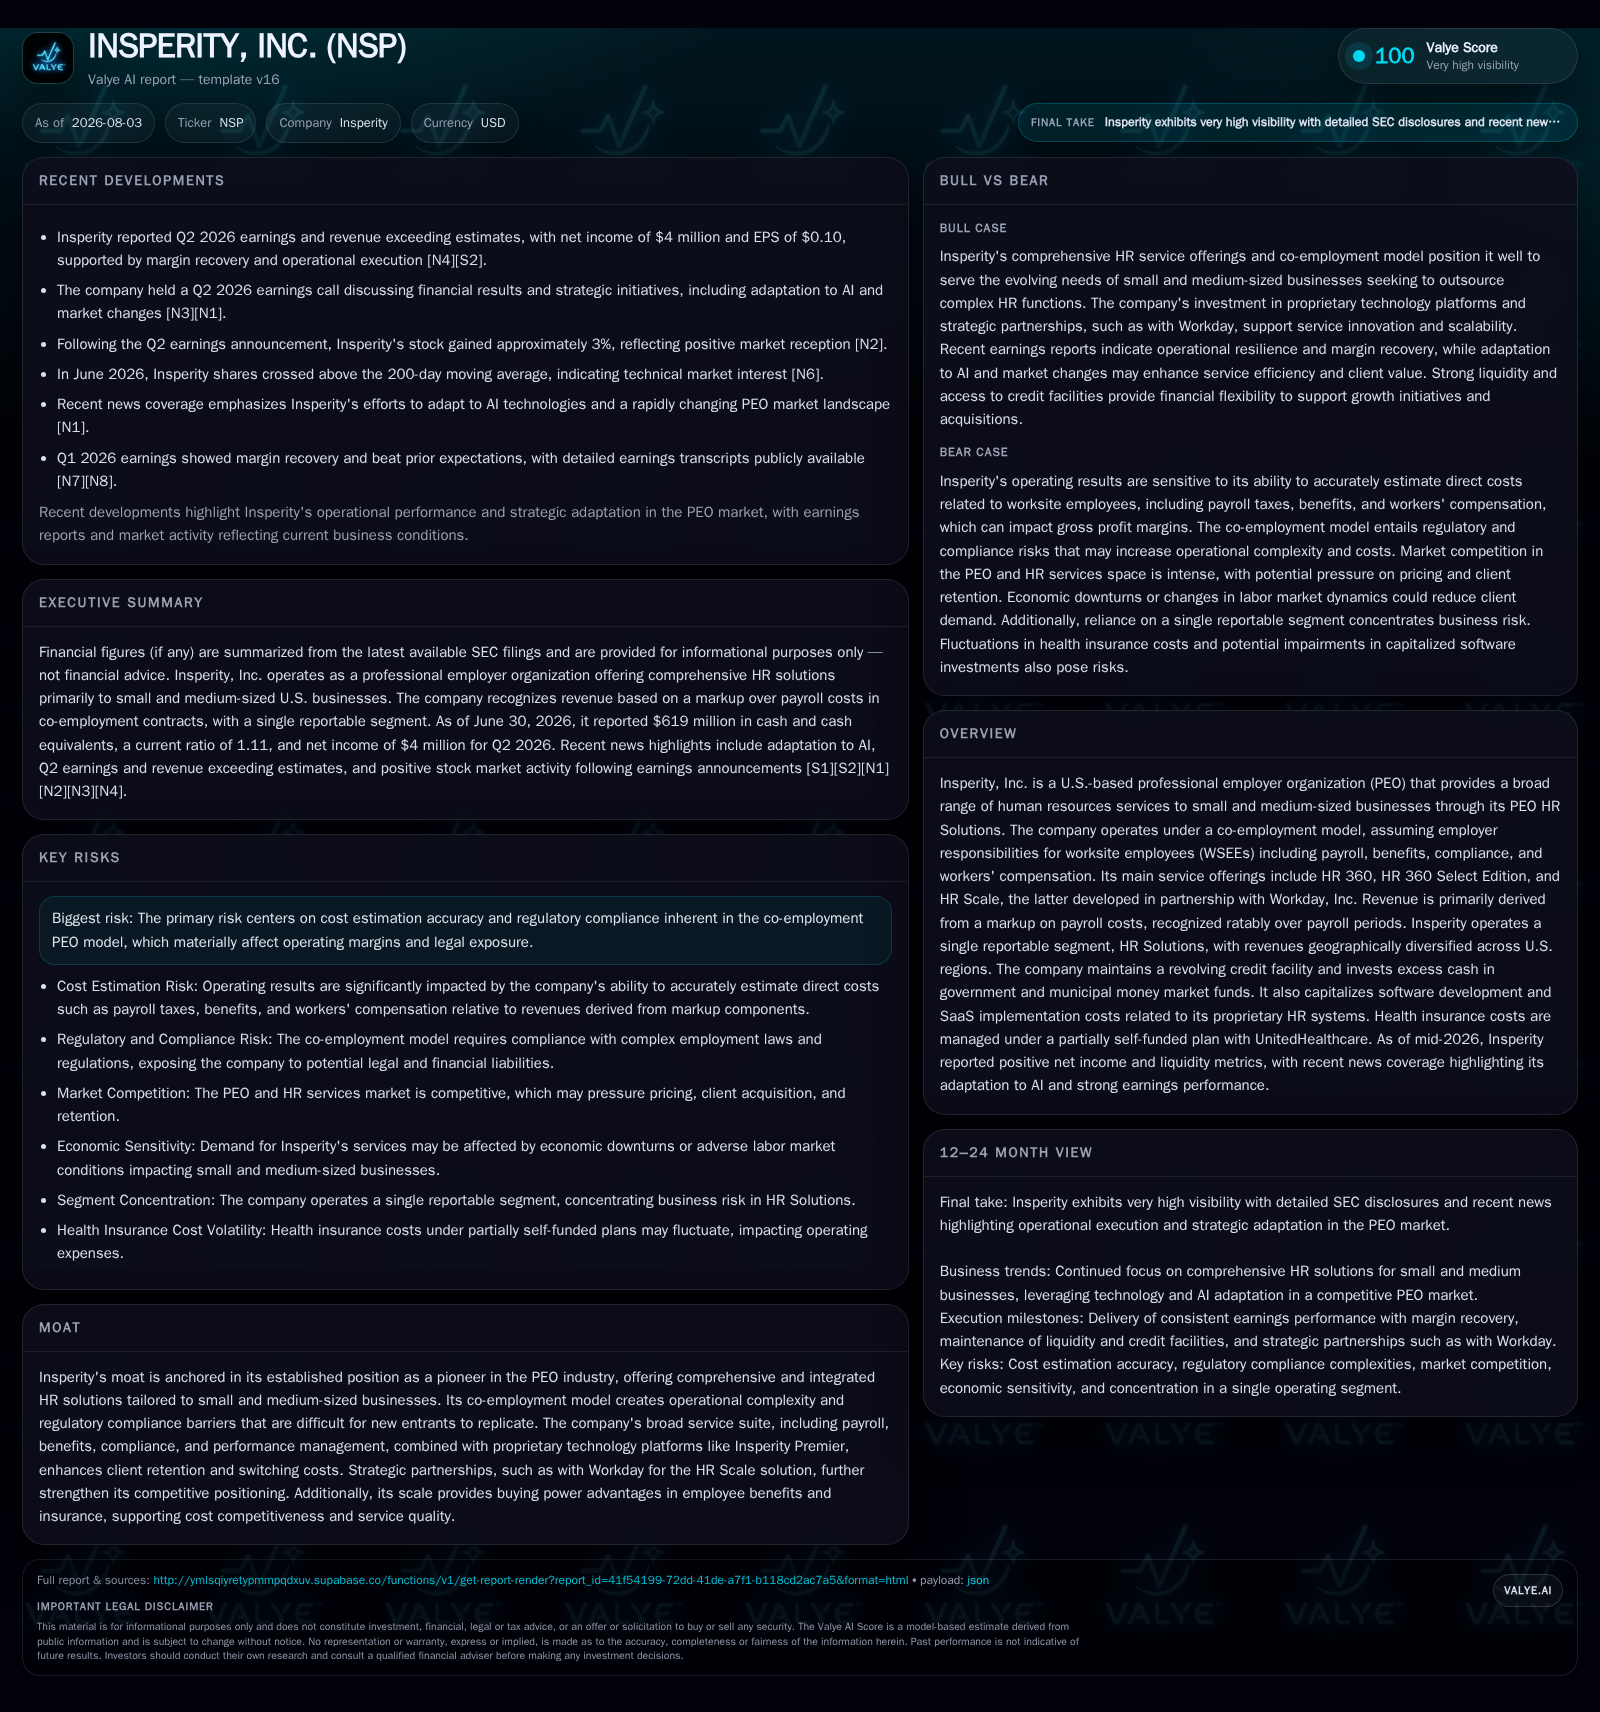
Insperity, Inc. reported robust operational metrics in the second quarter ending June 30, 2026, with an increase in average worksite employees paid per month supporting revenue growth. The company’s business model centers on a co-employment PEO framework primarily serving small to medium businesses, where revenue is recognized as a markup on payroll costs and related services. While revenue trends remain positive, margin compression persists owing to escalating benefits costs and workers’ compensation, reflecting a common industry-wide challenge. Insperity’s partnership with Workday for its HR Scale solution signals a strategic emphasis on technology-enabled service differentiation within competitive PEO markets. Financially, the company maintains a solid liquidity position with a current ratio above 1 and manageable net debt, underscoring its capacity to invest in growth initiatives amid evolving regulatory and cost environments.
Recent Operating Update: Q2 2026 Performance
Insperity’s latest quarterly filing (10-Q dated July 30, 2026) reveals continued operational progress anchored by an increase in the average number of paid worksite employees (WSEEs), which is the principal volume driver of its PEO HR Solutions revenue stream [S2]. While detailed quarterly numeric updates beyond balance sheet snapshots are limited here, media reporting confirms Insperity beat consensus expectations for Q2 earnings and revenues [N3], with stock reaction reflecting positive investor sentiment [N1]. This sustained traction in client headcount is critical as Insperity’s revenues are directly linked to payroll volumes of its co-employed worksite employees.
The business remains single-segment (HR Solutions) driven by co-employment contracts where Insperity assumes employer responsibilities including payroll administration, compliance, employee benefits procurement, and workers’ compensation insurance [S1]. Revenue recognition follows a ratable markup over payroll periods based on active WSEEs. Thus, revenue growth depends on both winning new clients (increasing WSEE count) and managing pricing changes per employee amid inflationary wage pressures.
Business Model Specifics: Co-Employment Drives Recurring Payroll Markups
Insperity operates through a comprehensive suite of PEO services branded under HR 360, HR 360 Select Edition (targeted more at middle market clients), and the newer HR Scale offering jointly developed with Workday Inc. HR Scale offers advanced human capital management technology integration designed for scalability among growing companies [S1].
The company enters into client service agreements that create a co-employment relationship—Insperity pays wages and administers benefits while sharing employer liability. This dual role adds complexity but also builds switching costs through compliance expertise and integrated HR support [S1]. Revenue mechanics depend heavily on the average number of WSEEs each month multiplied by markup rates negotiated in generally one-year contracts.
Gross profit per WSEE serves as a key performance indicator reflecting pricing power net of direct costs such as payroll taxes, benefits premiums (notably health insurance), and workers’ compensation claims and administrative charges [S13]. These direct costs are sensitive to labor market wage inflation as well as adverse claims experience in insurance programs—both significant margin risk factors.
Industry Context and Competitive Positioning
PEOs like Insperity compete with broad human capital management providers including divisions of ADP (TotalSource) and TriNet Group. Differentiation hinges on breadth of integrated offerings encompassing compliance support, insurance procurement scale advantages, performance management services, plus proprietary technology platforms such as Insperity Premier [S1].
The partnership with Workday reflects strategic intent to capture middle-market customers seeking more sophisticated HCM platforms without forfeiting the tailored consultative approach characteristic of Insperity’s model [S1]. This pairing addresses growing client demand for agility and ease of deployment while improving competitive positioning against software-native HCM providers.
Despite these strengths, the PEO market remains critically dependent on regulatory compliance expertise due to evolving labor laws impacting co-employment liabilities. Cost inflation in employee benefits further challenges margin sustainability industry-wide.
Growth Drivers
Key growth drivers for Insperity include:
- Increased outsourcing of HR functions by SMBs facing rising employment regulation complexity.
- Expansion within middle market firms that require scalable but sophisticated HCM technology solutions.
- Cross-selling additional business solutions bundled within existing client contracts boosting uptake per customer.
- Economic conditions supporting organic increases in client payroll volumes.
- Leveraging strategic technology partnerships like Workday to accelerate innovation pipeline.
These drivers intersect tightly with KPIs such as average WSEEs paid per month, client retention rates reflecting stickiness under co-employment contracts, pricing per employee adjusted for inflation factors, and gross profit per WSEE as an ongoing margin benchmark.
Risks and Watchpoints
Operating risks remain substantial given:
- Cost estimation accuracy for benefits plans and workers’ compensation liabilities affecting gross profit reliability.
- Regulatory shifts that can alter employer obligations or expose Insperity to legal challenges tied to co-employment arrangements.
- Competitive pressure in pricing from alternative HR outsourcing or payroll services potentially compressing markups.
- Integration risks involved in scaling newer product offerings like HR Scale without diluting service quality or increasing operating expenses prematurely.
- Macroeconomic downturns which could reduce client hiring or result in contract terminations given cancellable provisions usually requiring only short notice [S1]
Monitoring gross profit margin trends per WSEE alongside client retention data will be critical near-term indicators of resilience amid these headwinds.
What To Watch Next
Investors should track:
- Quarterly updates on average number of WSEEs paid—as this is the volume lever driving revenues.
- Gross profit per WSEE reflecting pricing power net of benefit cost inflation dynamics.
- Progress reports on adoption rates for the HR Scale product offering leveraging Workday’s technology platform.
- Operating expenses related to marketing/sales investments aimed at middle market expansion versus return metrics.
- Any changes or commentary around regulatory developments affecting co-employment risk profiles or benefit cost structures.
Further details during earnings calls or subsequent SEC filings could illuminate management’s execution against these strategic priorities [N2].
Financial Profile Discussion
As of June 30, 2026, Insperity reported $619 million in cash and equivalents against approximately $419 million in total debt resulting in a net cash position near $200 million [F1]. Meanwhile, current assets stand at roughly $1.77 billion versus current liabilities near $1.59 billion for a current ratio of about 1.11—indicating adequate near-term liquidity cushioning operational funding needs [F1].
This liquidity supports ongoing investments including software development capitalized under internal use software accounting policies [S1] alongside flexible capacity for acquisitions or share repurchases when opportunistic. The company maintains a revolving credit facility up to $750 million with availability that historically accommodates working capital fluctuations tied to payroll cycles [S12].
Reported operating income turned negative in calendar year 2025 due primarily to sharply higher benefits costs eroding gross profit margins despite modest revenue growth; net income mirrored this trend with a loss near $7 million for 2025 [F1]. This underlines the importance of successfully managing cost inflation drivers while scaling higher-margin product lines going forward.
Capital allocation continues balancing shareholder returns via dividends (~$90 million annually) alongside measured share repurchases promoting EPS accretion without jeopardizing cash reserves or debt covenants [S14][S17]
Disclaimer: This analysis is intended solely for informational purposes without any investment advice or research views regarding Insperity shares or securities. All referenced figures are sourced from official SEC filings and reliable news reports as cited.
Disclaimer: This is research-only, informational analysis and not investment advice. It may include AI-generated interpretation and general industry context. Always verify important details using primary sources.

Comments