
CoStar Group’s Aggressive Acquisition Strategy Compresses 2025 Profitability Despite Revenue Growth
CoStar leverages acquisitions to expand its real estate data and marketplace footprint but faces profit margin pressure and integration risks.
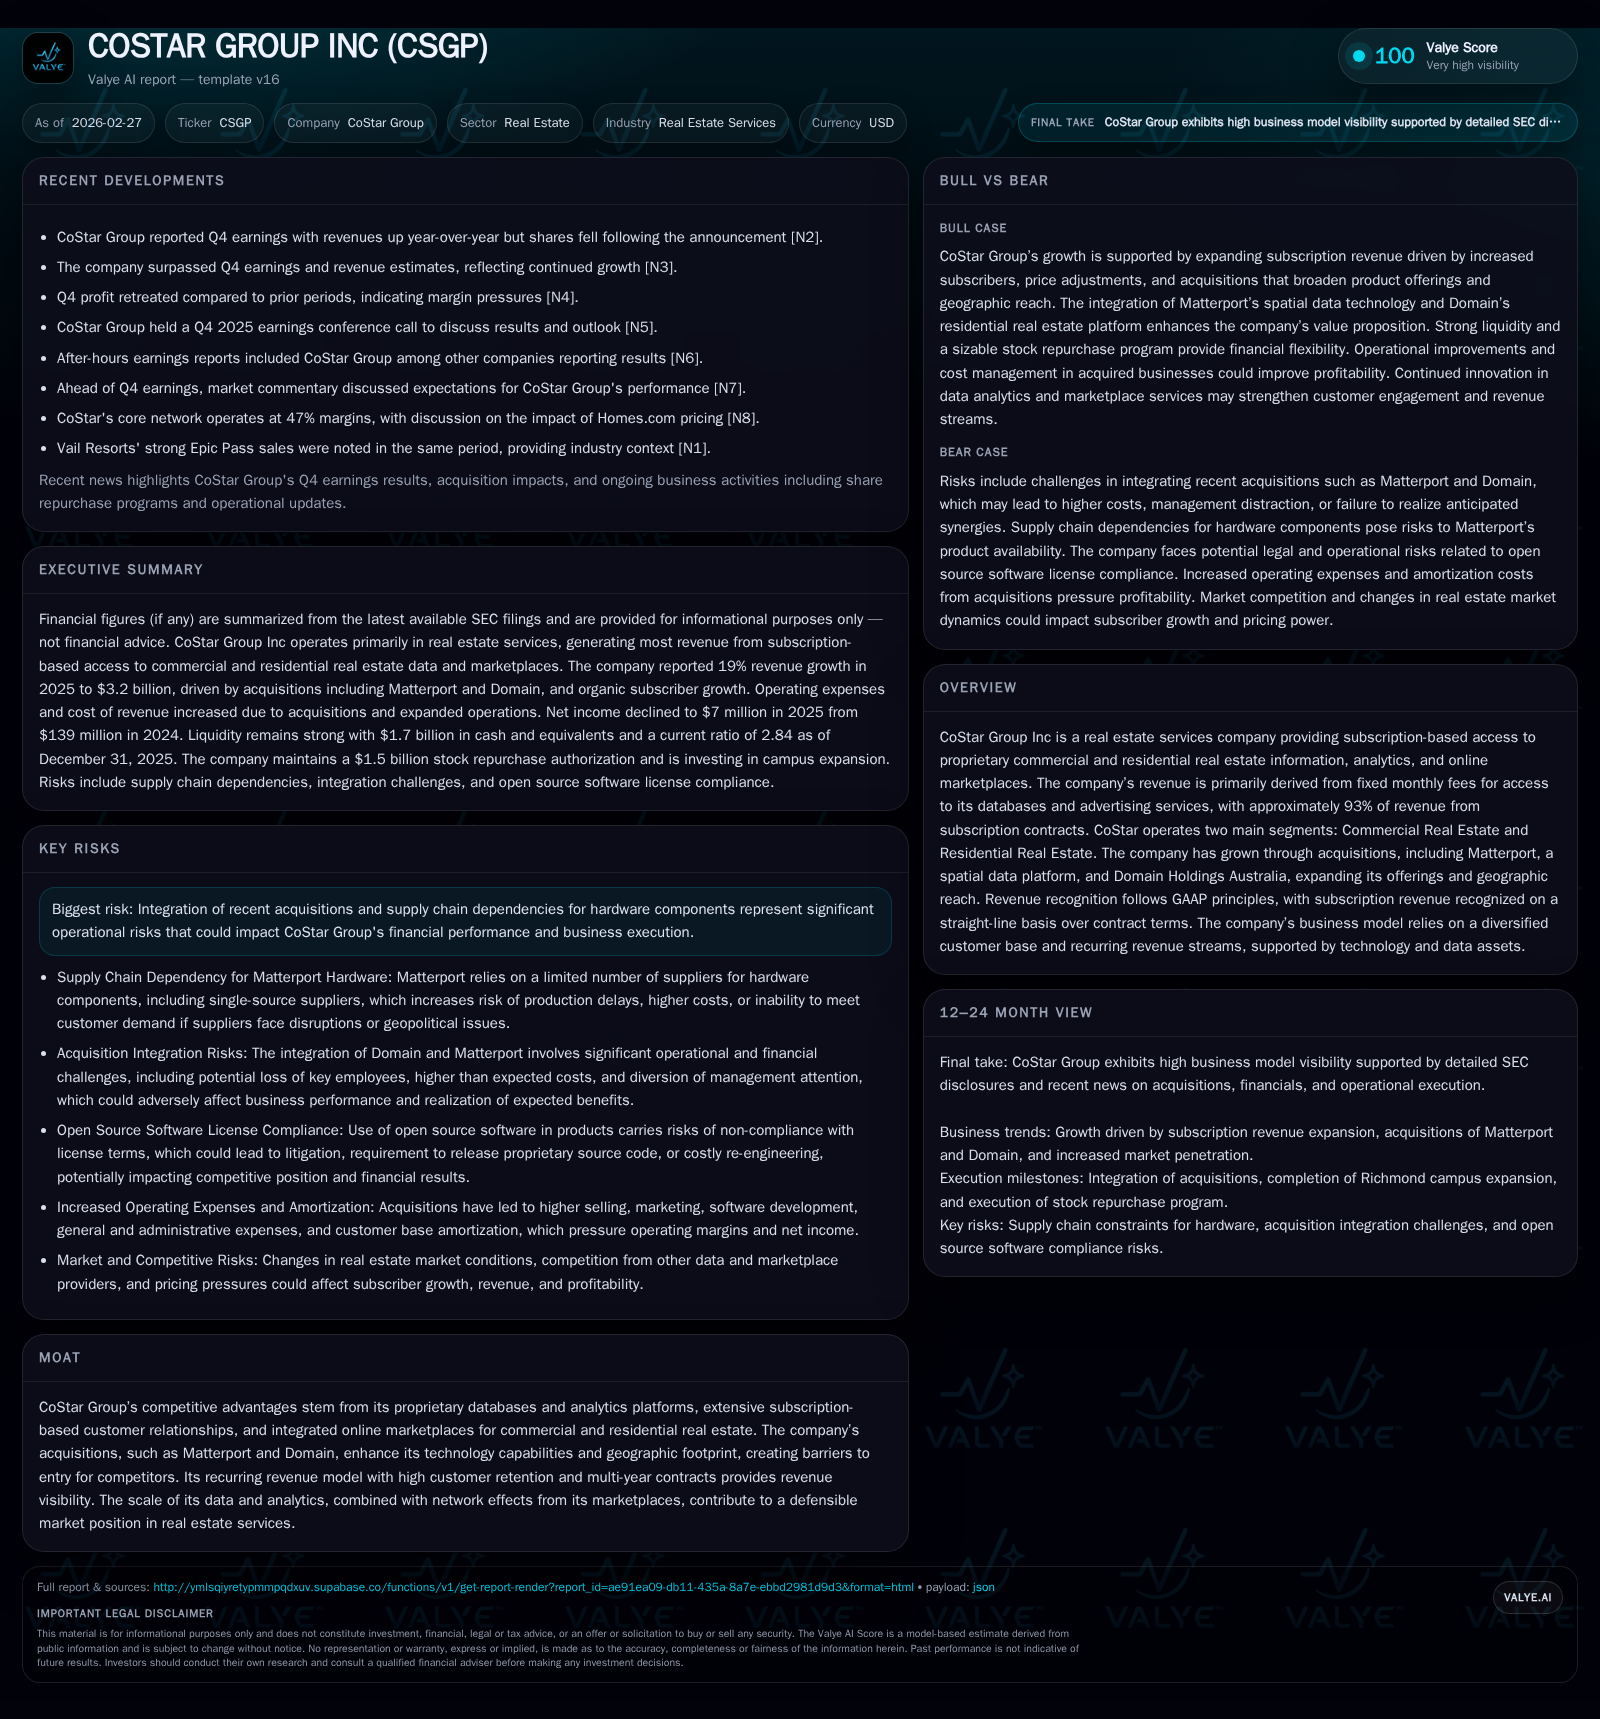
CoStar Group Inc expanded its revenue by 19% in 2025, driven primarily by acquisitions including Matterport and Domain Holdings Australia, which broadened its commercial and residential real estate data offerings. Despite topline growth reaching $3.2 billion, operating income turned negative due to increased amortization, personnel costs, and integration expenses tied to its recent acquisitions. The company maintains strong operating cash flow and a solid capital structure, supporting an aggressive share repurchase program totaling $1.5 billion authorization. Going forward, growth hinges on successful integration of new assets, supply chain stability for Matterport hardware, and residential market conditions.
Historical Financial Performance and Growth Drivers
CoStar Group's revenue climbed from approximately $2.74 billion in 2024 to $3.25 billion in 2025—a healthy increase of 19%—primarily fueled by significant acquisitions completed over the past two years [S1][S13]. Notably, the commercial real estate segment expanded by 18%, boosted by a $147 million revenue contribution from Matterport and additional revenue streams from Visual Lease (acquired late 2024) and Domain Holdings Australia (acquired mid-2025). The residential segment realized an even stronger percentage gain of 20%, with increased agent listings complemented by Domain’s network effects [S1]. Increased subscriber counts alongside inflation-driven price rises propelled CoStar’s legacy revenue lines.
However, the upward surge in revenue came at considerable cost. Operating expenses ballooned by over 21%, totaling $2.63 billion for the year as costs linked to acquisition integrations—including customer base amortization which nearly tripled—contributed materially [S1][S14]. This amplified expense base translated into an operating loss of $72 million compared to a small profit the prior year. Net income declined precipitously by roughly 95% to just $7 million due largely to elevated amortization charges on intangible assets accumulated through acquisitions plus a spike in effective tax rate caused by diminished U.S. taxable earnings [F1][S1][S18]. A concise summary table highlights key metrics:
Historical performance (annual)
| FY | Net ($mm) | CFO ($mm) | OpInc ($mm) | Capex ($mm) | Net YoY |
|---|---|---|---|---|---|
| 2025 | 7 | 430 | -72 | 307 | -95.0% |
| 2024 | 139 | 393 | 5 | 579 | -63.0% |
| 2023 | 375 | 490 | 282 | 118 | +1.4% |
| 2022 | 369 | 479 | 451 | 35 |
Source: SEC companyfacts cache [F1].
Capital returns and efficiency (annual)
| FY | FCF ($mm) | ROE% |
|---|---|---|
| 2025 | 123 | 0.1 |
| 2024 | -186 | 1.8 |
| 2023 | 372 | 5.1 |
| 2022 | 443 | 5.4 |
Source: SEC companyfacts cache [F1].
Growth has historically been propelled by subscriptions providing access to proprietary commercial and residential real estate databases augmented by online marketplaces charging fixed monthly fees [N2][S23]. Meanwhile, CoStar continues geographic expansion through international acquisitions such as Domain Holdings Australia bringing diversified exposure beyond primarily North America [N3][S19].
Future Growth Prospects
CoStar’s recent large-scale acquisitions bolster its competitive moat through proprietary spatial data solutions (Matterport) and broadening its reach within Australia’s residential real estate market (Domain) [N3]. While these moves create valuable network effects and technological capabilities difficult for competitors to replicate quickly, strategic execution risk looms.
Matterport introduces unique operational dependencies on limited hardware suppliers concentrated in geopolitically sensitive regions like China, exposing CoStar to supply chain interruptions that could hinder hardware availability or inflate costs [S2][S25]. Integration complexity rises as the company consolidates diverse data architectures and platforms while aiming for cost synergies without disrupting customer service.
Subscription renewal rates exceeding typical multi-year contract commitments underpin revenue visibility; however, pricing headwinds appear in segments where average realized prices softened despite volume growth—in part due to competitive discounting or market mix shifts [S1]. Residential sign-ups remain robust but face margin trade-offs given promotional strategies used during acquisition ramp-up phases.
Foreign exchange volatility represents a nontrivial factor as roughly one-tenth of revenues derive internationally; CoStar uses deal-contingent foreign currency forwards but posted a cumulative loss related to hedges around the Domain deal settlement last year [S17]. Balanced against these risks are opportunities such as cross-selling enhanced analytic tools across both commercial and residential user bases leveraging Matterport’s digital twin platform synergy.
Forecasts, Milestones & Capital Allocation Expectations
While explicit guidance from management for upcoming fiscal periods is absent from the sources reviewed [N4], watchpoints include quarterly subscription growth trends especially within newer assets like Domain’s agent network and Matterport’s hardware adoption curve. Monitoring subscription pricing strategies post-integration will be critical along with cost efficiency improvements expected midway through operational harmonization phases.
Capital allocation has skewed heavily toward share repurchases following prior buildup via cash-rich acquisitions. In December 2025 the Board authorized a new stock buyback program up to $1.5 billion; plans include an initial accelerated share repurchase of approximately $500 million executed early in calendar year 2026 alongside additional open-market repurchases approximating another $200 million [S5][S8][N2]. Despite recent cash burn on investing activities mostly allocated toward acquisition-related outlays ($2.8 billion used in investing during fiscal year), strong free cash flow generation evident from cash flow from operations exceeding capex allows funding of shareholder returns while maintaining liquidity buffers [F1][S28].
Debt levels remain moderate with only about $1 billion senior notes outstanding at low fixed interest rates (2.8%) maturing mid-2030; no borrowings were drawn under the revolving credit facility as of late 2025 easing leverage concerns [S11][S16]. Expansion at headquarters continues with campus development projects slated for completion H1-2026 requiring incremental capex spend ($155 million obligated remaining), partially offset by negotiated tax incentives contingent on job creation targets providing some financial mitigants [S12].
Returns Metrics & Capital Structure Overview
Returns suffered notably as net income plunged despite stable top-line momentum: Return on Equity based on latest reported equity approximates near breakeven at ~0.1% driven by low profitability fundamentals despite substantial equity base expansion fueled by acquisition goodwill accumulation surpassing $6 billion [F1][S9][S20]. Operating income swung negative signaling a pronounced mismatch between growth spending/amortization burdens versus net earnings realization timing.
Strong operating cash flow generation sustained above $400 million annually provides CoStar with ample free cash flow capability after accounting for materially reduced capital expenditures this past year relative to prior spikes associated with investment activity [F1][S28]. Capital return programs including aggressive share repurchases totaling several hundred million dollars planned upfront support shareholder value initiatives amid transitional earnings pressure [S8]. Dividend payments were not highlighted suggesting reinvestment into growth remains prioritized.
Industry Position and Moat Commentary
CoStar Group operates at the nexus of real estate information services where high barriers arise through scale-dependent proprietary datasets combined with embedded analytics platforms leveraged via fixed-fee subscription models ensuring customer stickiness. Network effects emerge particularly in marketplaces where buyers and sellers congregate on integrated portals promoting depth visibility.
Acquisitions underpin sustainable differentiation: Matterport’s spatial capture technology embeds physical-to-digital convergence reinforcing data defensibility while Domain enhances geographic diversity reducing reliance on U.S.-centric market cycles. However, investors should acknowledge prolonged earn-back horizons on intangible asset investments moderate near-term returns—the combination of hardware-driven spatial models with software/marketplace services involves complex product-market fit iterations subject to technological adoption curves.
Operational Risks
Integration complexity represents a prominent risk area: multiple high-value acquisitions escalating operating expense structures without immediate profitability upside press margins down causing volatile results as seen through fiscal year-end losses despite underlying growth gains [S9][N13]. Hardware supply chain fragility tied to Matterport inflates downside risk as component procurement relies heavily on few qualified manufacturers vulnerable to geopolitical trade restrictions or disruptions affecting production schedules [S2].
Given these factors, monitoring management’s continued execution discipline around customer retention amidst price changes alongside careful cost control implementation post-acquisition will be critical.
Conclusion & Watchlist Items for Future Reporting
For stakeholders tracking CoStar’s trajectory beyond headline revenues are keen observations around:
- Integration progress updates especially realization of operational synergies within Matterport/Domain segments,
- Subscription renewal rates net of price adjustments,
- Hardware supply chain status impacting capture device availability,
- Free cash flow trends relative to reinvestment/buildout initiatives,
- Exposure management against currency volatilities,
- Any impairment signals given sizable goodwill/intangible carrying amounts,
- Updates on share repurchase pacing aligned with liquidity outlook.
While recent results reflect growing pains characteristic of rapid scale via M&A consolidation particular caution applies until margin recovery aligns more visibly with growth achievements.
This report is based solely on publicly available information as sourced above with no predictive assertions or investment recommendations intended or implied herein.
Disclaimer: This is research-only, informational analysis and not investment advice. It may include AI-generated interpretation and general industry context. Always verify important details using primary sources.
Comments