
Coterra Energy’s Earnings Surge and Strategic Merger Signals New Growth Phase
Coterra Energy reports strong fiscal 2025 gains amid a pivotal merger with Devon Energy that will reshape its operational and financial outlook.
In 2025, Coterra Energy experienced a pronounced resurgence, with revenue climbing 40.1% and operating income expanding 76.5% year-over-year, underscoring a sharp operational leverage rebound after prior volatility. This financial momentum coincides with a significant, pending merger with Devon Energy, promising scale benefits but accompanied by integration and regulatory complexities. The company maintained moderate liquidity and showcased disciplined capital allocation with steady dividends and reduced buybacks, setting the stage for strategic prioritization amid midstream constraints and regulatory challenges.
Rebound Revealed: Coterra’s Fiscal 2025 Performance Metrics
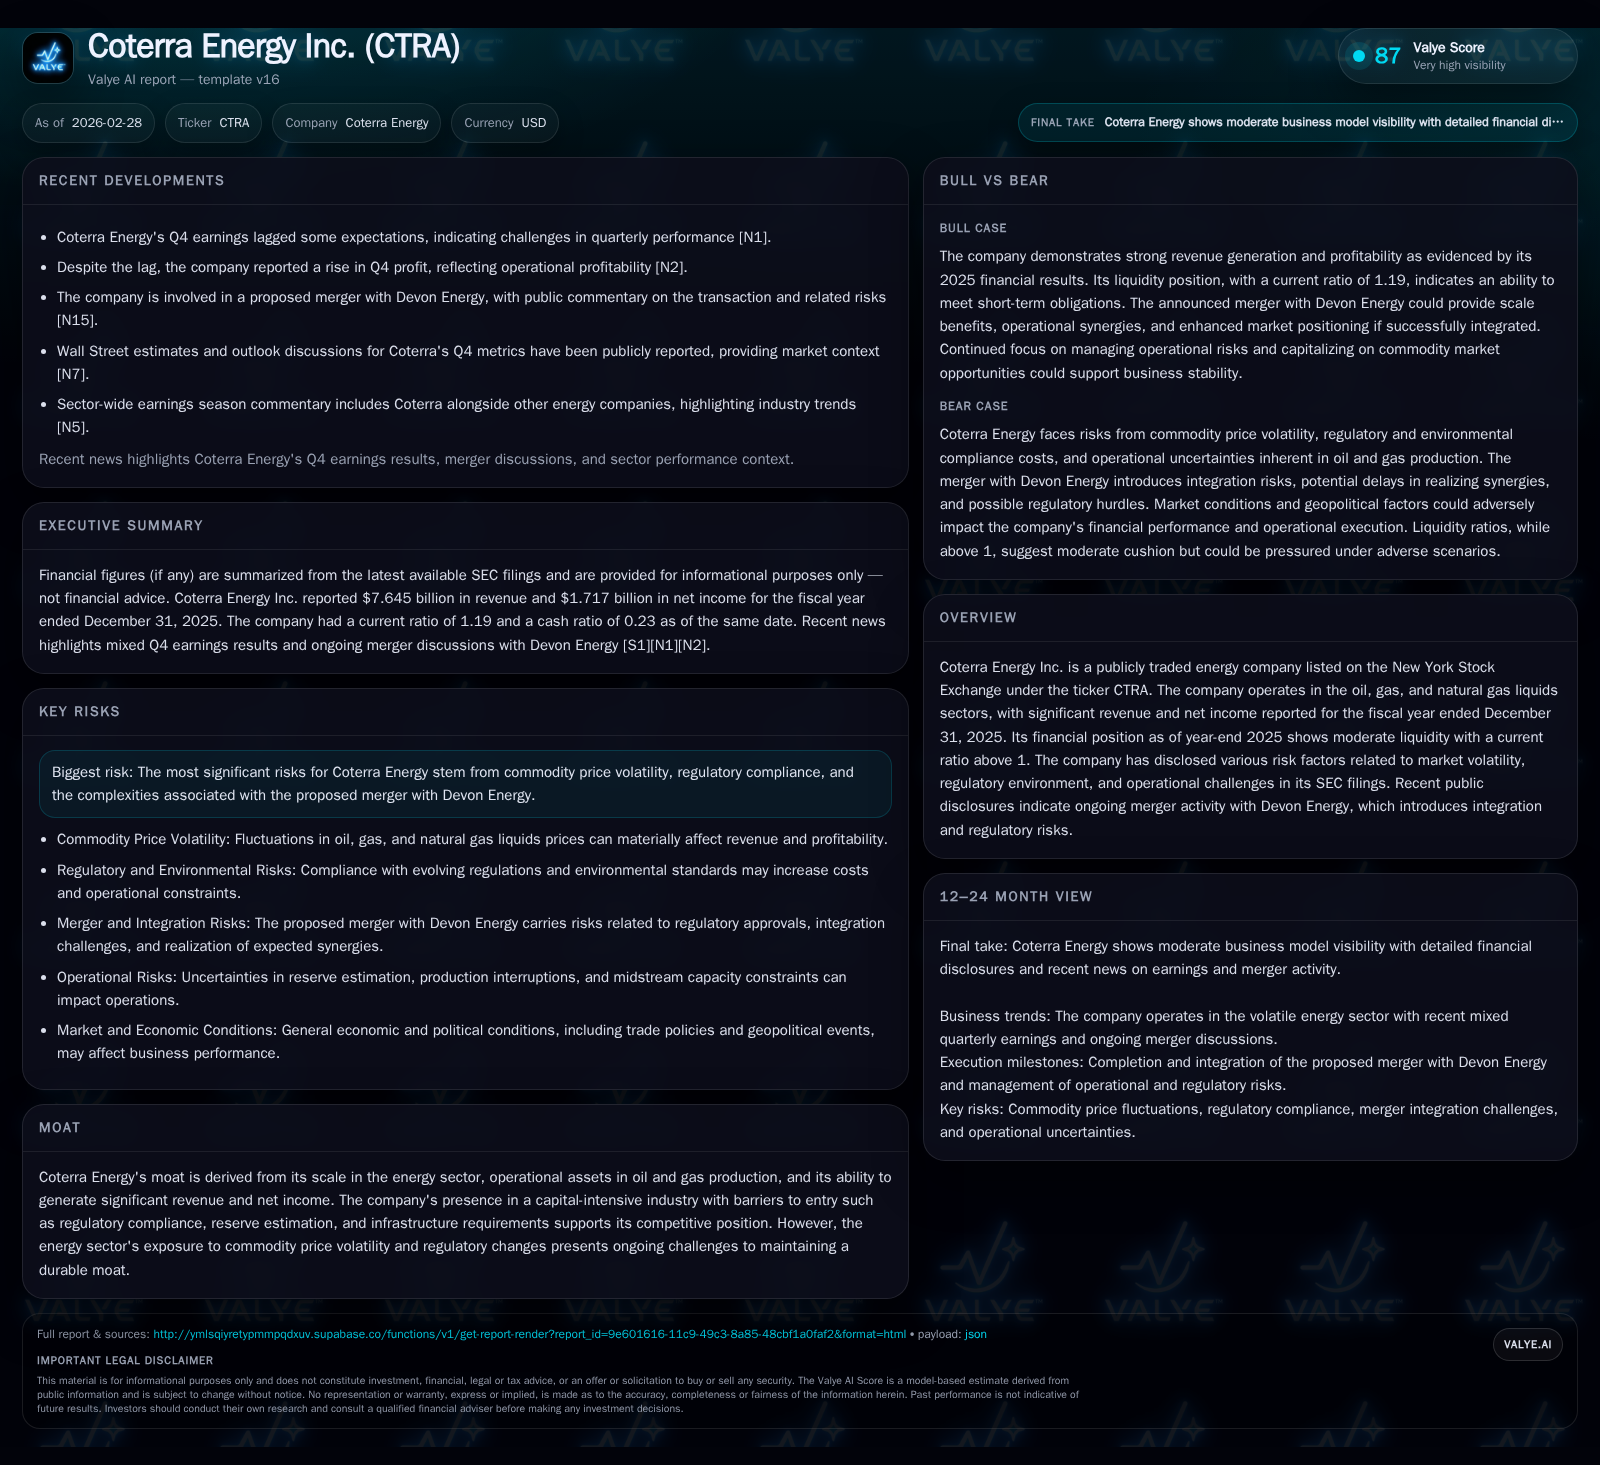
Coterra Energy marked a substantive rebound in its fiscal year ended December 31, 2025. Revenue climbed to $7.645 billion, an increase of 40.1% compared to $5.458 billion in FY2024 [F1]. Operating income experienced an even sharper rise to $2.452 billion, up 76.5% from $1.389 billion the prior year [F1]. Net income followed suit with a gain of 53.2%, reaching $1.717 billion in FY2025 versus $1.121 billion in FY2024 [F1]. Operating cash flow stood at $4.021 billion, a robust improvement of nearly 44%, supporting improved liquidity with a current ratio of approximately 1.19 based on current assets of $1.849 billion against current liabilities of $1.557 billion [F1]. Capital expenditures edged down by almost 11%, evidencing cautious reinvestment strategies underpinned by prudent cash flow management [F1]. These figures reflect an operational leverage dynamic where realized pricing strength amplified margin expansion beyond top-line growth.
Historical performance (annual)
| FY | Rev ($bn) | Net ($bn) | CFO ($bn) | OpInc ($bn) | Rev YoY | Net YoY |
|---|---|---|---|---|---|---|
| 2025 | 7.6 | 1.7 | 4.0 | 2.5 | +40.1% | +53.2% |
| 2024 | 5.5 | 1.1 | 2.8 | 1.4 | -7.7% | -31.0% |
| 2023 | 5.9 | 1.6 | 3.7 | 2.2 | -34.7% | -60.0% |
| 2022 | 9.1 | 4.1 | 5.5 | 5.2 |
Source: SEC companyfacts cache [F1].
Capital returns and efficiency (annual)
| FY | Div ($mm) | Buybacks ($mm) | ROE% |
|---|---|---|---|
| 2025 | 170 | 141 | 11.6 |
| 2024 | 156 | 455 | 8.5 |
| 2023 | 405 | 12.5 | |
| 2022 | 1250 | 32.1 |
Source: SEC companyfacts cache [F1].
*Negative YoY % denotes comparative period declines prior to the rebound observed in FY2025.
Drivers Behind Last Year’s Earnings Acceleration
The earnings acceleration chiefly derives from an improved commodity price environment and associated realized pricing gains after hedging activities reported for Q4 indicate average sales prices including hedges of $60.34 per barrel for oil and $2.44 per Mcf for natural gas [S25]. Enhanced scale benefits from stable production volumes complemented cost-control initiatives as detailed in recent earnings releases [N14][S3]. Given Coterra's sector position predominantly in oil, gas, and NGLs, margin improvement was further buoyed by favorable NGL pricing which held steady at roughly $15.63 per barrel including hedges [S25]. Operating leverage was also heightened via integrated expense management programs focused on reducing unit production costs while navigating midstream capacity constraints that tightened supply chains [S14]. Together these elements elevated profitability beyond mere price uplift effects.
Merger with Devon Energy: Strategic Rationale and Integration Risks
The pending acquisition of Coterra by Devon represents a transformative scale transaction primed to consolidate their collective operational footprint across U.S.-based upstream assets [N8][N9][S14]. This consolidation aims to enhance synergies particularly around optimizing midstream logistics networks while improving reserve economics through combined asset development plans [N8]. Governance arrangements designate balanced board representation reflecting ownership proportions with executive roles split between both companies’ leadership teams post-close [S20][S29]. Nonetheless, execution risks include potential delays or impositions arising from regulatory reviews under antitrust statutes as well as challenges embedding information technology systems and cultural integrations during transition phases [S14][S15]. Moreover, there is explicit caution about possible diversion of managerial bandwidth away from core operations due to transaction-related affairs potentially impacting near-term performance trajectories [S14].
Analyzing Commodity Prices and Regulatory Environment Impact
Commodity price volatility continues as a substantial external influence on Coterra’s growth prospects though mitigated partly by hedge accounting practices which smooth realized earnings streams [S25]. On regulatory aspects, the risk disclosures highlight increasing compliance burdens tied especially to operations on federal lands where environmental oversight intensifies, alongside evolving water disposal regulations that could increase operational costs or constrain field development plans [S4][S5][N7]. Midstream infrastructure bottlenecks further compound constraints whereby existing takeaway capacities limit throughput leading to potential production interruptions—an operational headwind identified explicitly in filings [S14]. These factors collectively delineate boundaries within which Coterra must navigate market uncertainties while pursuing growth.
Capital Allocation: Dividends, Buybacks, and Free Cash Flow Deployment
Coterra demonstrates balanced capital allocation discipline reflective of capital-intensive energy sector norms yet aligned towards shareholder value support amid shifting earnings power [F1][S20][S26]. Dividends saw a modest uptick from $156 million in FY2024 to $170 million in FY2025 maintaining yield appeal while buybacks tapered sharply nearly threefold from $455 million to $141 million indicative of cautious fiscal stewardship possibly tied to merger anticipation impact on free float dynamics [F1]. Calculated return on equity approximates 11.6%, computed as net income over book equity at year-end ($1.717B / $14.838B) affirming effective equity utilization despite sector cyclicality [F1]. Free cash flow estimated conservatively by subtracting capex from operating cash flow yielded around $3.87 billion supporting ongoing returns alongside debt servicing commitments without sacrificing liquidity buffers [F1][S7].
Looking Forward: Milestones to Watch and Forecast Considerations
Absent explicit management guidance post-merger announcement [N7], key metrics warrant monitoring include pace and outcomes of regulatory approval processes anticipated over coming months which will indelibly shape transaction timing and terms [N8][S14]. Post-close integration assessments concentrating on synergies claimed versus realized cost savings will directly affect forward earnings profiles plus evolving commodity prices remain crucial external variables influencing revenue forecasts given operational gearing effects [N7]. Industry observers should note corporate governance transitions scheduled post-merger affecting decision-making dynamics outlined in proxy materials filed contemporaneously with SEC registrations [S20][S26].
Risks Hotspot: Navigating Volatility, Compliance, and Execution Challenges
Investor attention remains focused on several key risk domains extensively cataloged in SEC filings: volatile oil/gas/NGL price swings threaten revenue stability; ongoing litigation tied to legacy operations introduces contingent liabilities; cybersecurity vulnerabilities pose rising concerns especially amid technology integrations triggered by the merger; continuous tightening environmental regulations may elevate compliance costs; shareholder activism could pressure strategic directions; plus macroeconomic uncertainties ranging from government shutdowns to trade policy shifts create additional headwinds [S4][S5][N9][N14]. While certain risk mitigation strategies involving hedging programs or insurance coverage are employed within governance frameworks [S14], residual exposures persist necessitating vigilant risk management.
Disclaimer: This report is intended solely for informational purposes based on available public disclosures as of February 28, 2026, without offering any investment advice or projections beyond cited sources.
Disclaimer: This is research-only, informational analysis and not investment advice. It may include AI-generated interpretation and general industry context. Always verify important details using primary sources.
Comments