
Walt Disney’s Q2 Update Highlights Fresh Momentum Under New Leadership
Disney’s latest quarterly report reveals operational gains driven by streaming growth and theme park recovery amid strategic shifts under new leadership.
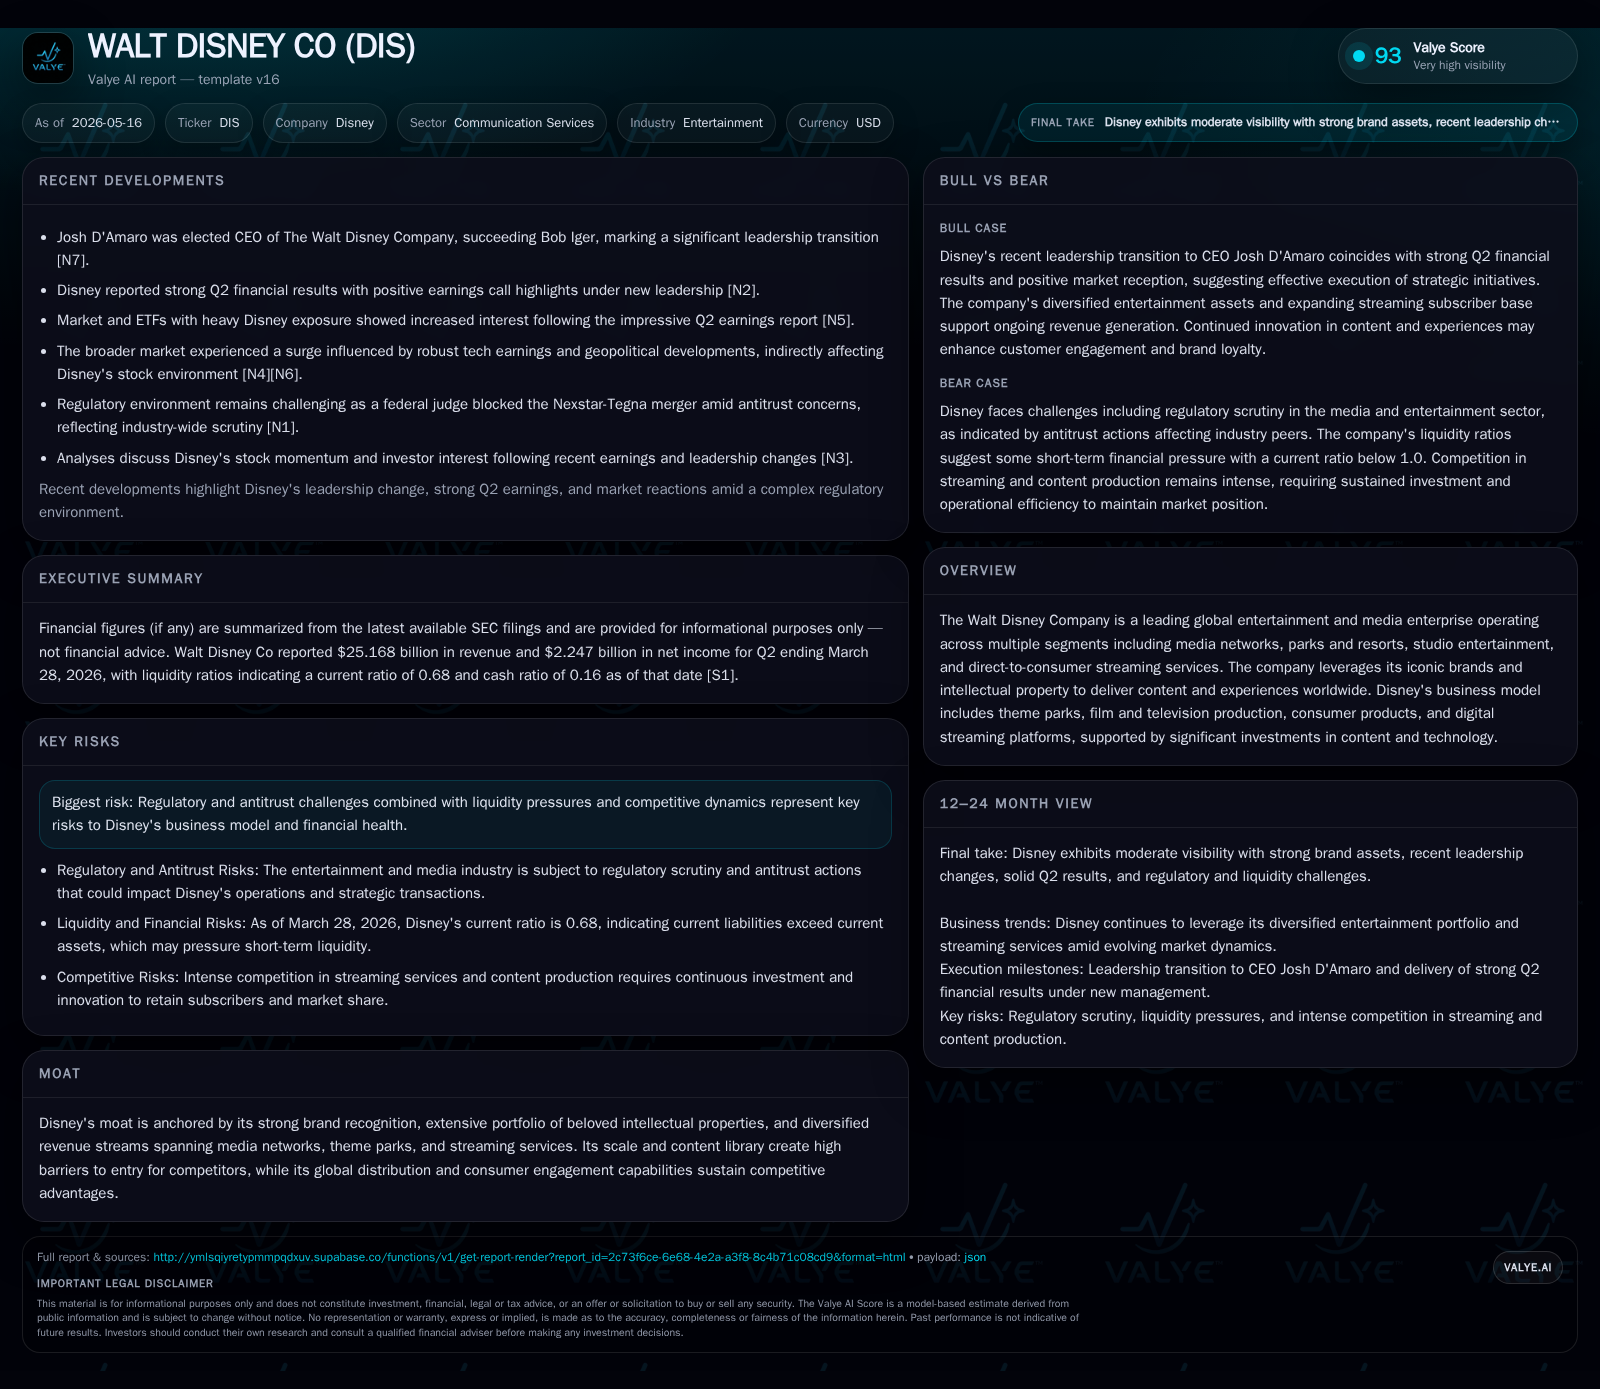
The Walt Disney Company’s May 2026 10-Q filing highlights encouraging progress in its core businesses with streaming subscriptions stabilizing and theme parks showing strong revenue rebounds. Management’s renewed focus on content investments and operational efficiencies points to a recalibrated growth trajectory under CEO Josh D’Amaro. However, liquidity constraints and regulatory scrutiny remain important risks to monitor.
Latest Quarterly Operating Highlights: Signs of Strategic Progress
Disney's Q2 fiscal 2026 filing (ended March 28, 2026) anchored by the May 6, 2026 SEC disclosures [S2, S3] revealed meaningful signs of operational momentum. The company reported stabilization in Disney+ subscriber counts following prior quarters of softness, reflecting effective content refreshes and pricing optimizations emphasized during the recent earnings call [N1]. Parks & Resorts experienced a rebound in revenues driven by both higher attendance figures and increased per capita spending, suggestive of a broader consumer re-engagement post-pandemic pressures.
Management commentary highlighted CEO Josh D’Amaro’s impact since assuming full leadership earlier in the fiscal year [S16], underscoring a sharpened focus on capitalizing on synergy between segments—streaming IP feeding demand to parks and consumer products. While Media Networks remained stable, Studio Entertainment leveraged strong theatrical releases aligned with key franchises. These dynamics collectively recalibrate near-term growth expectations.
Notwithstanding positives, the release cautioned on margin pressures partially from inflation-linked costs in parks and content production expenses. Updated guidance retained a cautiously optimistic tone balancing investment spend against emerging macro uncertainties [N2].
Disney’s Business Model: Multi-Segment Integration With Iconic IP
Disney operates four main reporting segments: Media Networks, Parks & Resorts, Studio Entertainment, and Direct-to-Consumer & International streaming services [S1]. Revenue flows from diverse sources—advertising, affiliate fees on cable networks, theme park admissions plus ancillary spending (food/beverage, merchandise), film distribution fees, licensing of intellectual property (IP), and subscription fees from Disney+ alongside Hulu and ESPN+ platforms.
The company’s moat is deeply rooted in its unparalleled brand portfolio—Marvel, Star Wars, Pixar, Disney classics—that commands premium pricing power and drives customer loyalty globally. This IP pipeline supports repeated content monetization cycles spanning theatrical windows through home entertainment to themed experiences.
Streaming economics rest heavily on subscriber volume growth weighed against content acquisition/production cost escalations. Disney's ability to integrate streaming with cross-promotion to parks (e.g., launch tie-ins) is distinctive amidst peers. Parks face physical capacity limits but have demonstrated resilience via enhanced guest experience offerings enabling yield improvements.
Switching costs are notably high due to ecosystem lock-in via exclusive franchises and broad demographic appeal ranging from children to adults. Licensing offshoots furnish additional revenue diversification but can be susceptible to regulatory or contractual changes.
Industry Context: Competitive Dynamics in Entertainment and Streaming
Disney competes against heavyweight global entities such as Netflix and Amazon in streaming—with ongoing shifts toward direct-to-consumer models that upend traditional media network economics. While OTT players chase scale via content spend often at the cost of near-term profits, Disney balances premium branded content investments with synergies across physical assets.
In theme parks, global operators like Universal Studios and regional Asian parks are increasingly competitive as travel patterns normalize; COVID-induced closures accelerated innovation around capacity management and safety protocols. Regulatory scrutiny notably targets anti-competitive practices within media conglomerates; ongoing antitrust debates form a non-trivial overhang affecting future M&A or licensing arrangements [S20], [N6].
Technology evolution toward AI-powered personalization and augmented reality experiences presents both an opportunity for differentiation and an execution risk if pace is misaligned with consumer adoption.
Key Growth Drivers: Streaming Expansion and Theme Parks Recovery
Recent subscriber trends indicate that strategic content launches—a mix of tentpole Marvel/IP sequels alongside localized international offerings—are stabilizing streaming revenues after previous subscriber churn episodes [S2], [N1]. Geographic expansion into emerging markets with tailored pricing contributes incremental volume gains.
Parks & Resorts continue their trajectory of recovering visit volumes post-pandemic with management noting increased per-ticket experiential spending as a positive margin driver. Enhanced digital ticketing systems aid in analytics-driven yield management.
Studio Entertainment benefits from scheduled slate releases tied to known franchises maintaining profitability despite theatrical window shortening industry-wide.
Industry-native KPIs such as net adds for Direct-to-Consumer subscribers and same-park attendance provide direct visibility into these drivers. These metrics underpin projected cash flow improvements reliant on achieving operating leverage amid fixed-cost structures.
Risks and Headwinds: Regulatory, Financial, and Competitive Challenges
Regulatory headwinds encompass intensified antitrust reviews that could curtail content licensing deals or future acquisition ambitions [S20]. Liquidity remains constrained evidenced by a current ratio of 0.68 [F1], posing refinancing vigilance given net debt near $35.6 billion [F1]. These leverage levels while typical for conglomerates require careful balance against capex demands.
Competitive pressure from established streamers with aggressive pricing strategies alongside emerging niche players heightens audience fragmentation risks. Additionally, macroeconomic factors influencing consumer discretionary spending can directly impinge on Parks’ performance—which still accounts for a material share of operating income.
Operational risks include potential restructuring costs or litigation exposures flagged in filings which can intermittently compress margins. Disruptions from rapid technological change also pose execution challenges if consumer trends shift faster than Disney’s supply pipeline can adapt.
Critical Indicators to Monitor: Execution Metrics and Market Signals
Looking forward, close attention to Q3 filings will be critical to assess whether subscriber stability turns into meaningful growth acceleration amid fresh franchise premieres [S2], [N1]. Parks attendance data coupled with yield improvements will signal the sustainability of the recovery phase.
Capital allocation choices including pace of debt reduction or reinvestment in new park attractions/content franchises will shape financial flexibility onward. Management commentary on operating expense discipline alongside marketing spend efficiency offers insight into margin trajectory.
Content release cadence (both theatrical blockbusters and streaming originals) acts as demand catalysts integral to maintaining subscriber engagement metrics vital in this high churn sector [N7].
Financial Snapshot: Liquidity, Debt Profile, and Capital Allocation
Latest financial snapshot
| Metric | Value | Period |
|---|---|---|
| Cash & equivalents | $5.7bn | |
| 2026-03-28 | ||
| Current assets | $24.6bn | |
| 2026-03-28 | ||
| Current liabilities | $36.2bn | |
| 2026-03-28 | ||
| Current ratio | 0.68x | |
| 2026-03-28 |
Source: SEC companyfacts cache [F1].
| Metric | Value (USD) |
|---|---|
| Cash & Equivalents | 5.68 Billion |
| Total Debt | 41.25 Billion |
| Net Debt | 35.57 Billion |
| Current Ratio | 0.68 |
As of quarter-end March 28, 2026 [F1], Disney holds cash balances around $5.7 billion against total debt exceeding $41 billion primarily composed of fixed-rate notes issued in recent years [S18]. The resulting net debt position implicates ongoing refinancing vigilance but is mitigated by sizeable cash flow generation characteristic of its integrated business lines.
The current ratio below one reflects seasonally elevated current liabilities relative to short-term assets but should be interpreted within the context of significant operating cash inflows expected over ensuing quarters [S2]. Capital structure supports necessary reinvestment programs though heightened market volatility or credit events could tighten financing conditions temporarily.
This analysis is intended solely for informational purposes based on publicly available filings without providing investment recommendations.
Disclaimer: This is research-only, informational analysis and not investment advice. It may include AI-generated interpretation and general industry context. Always verify important details using primary sources.

Comments