
Domino’s Growth Engine: Franchise Scalability Meets Tech-Driven Convenience
Domino’s July 2026 quarterly filing underscores resilience of its franchise-based growth model powered by technological innovation and supply chain integration.
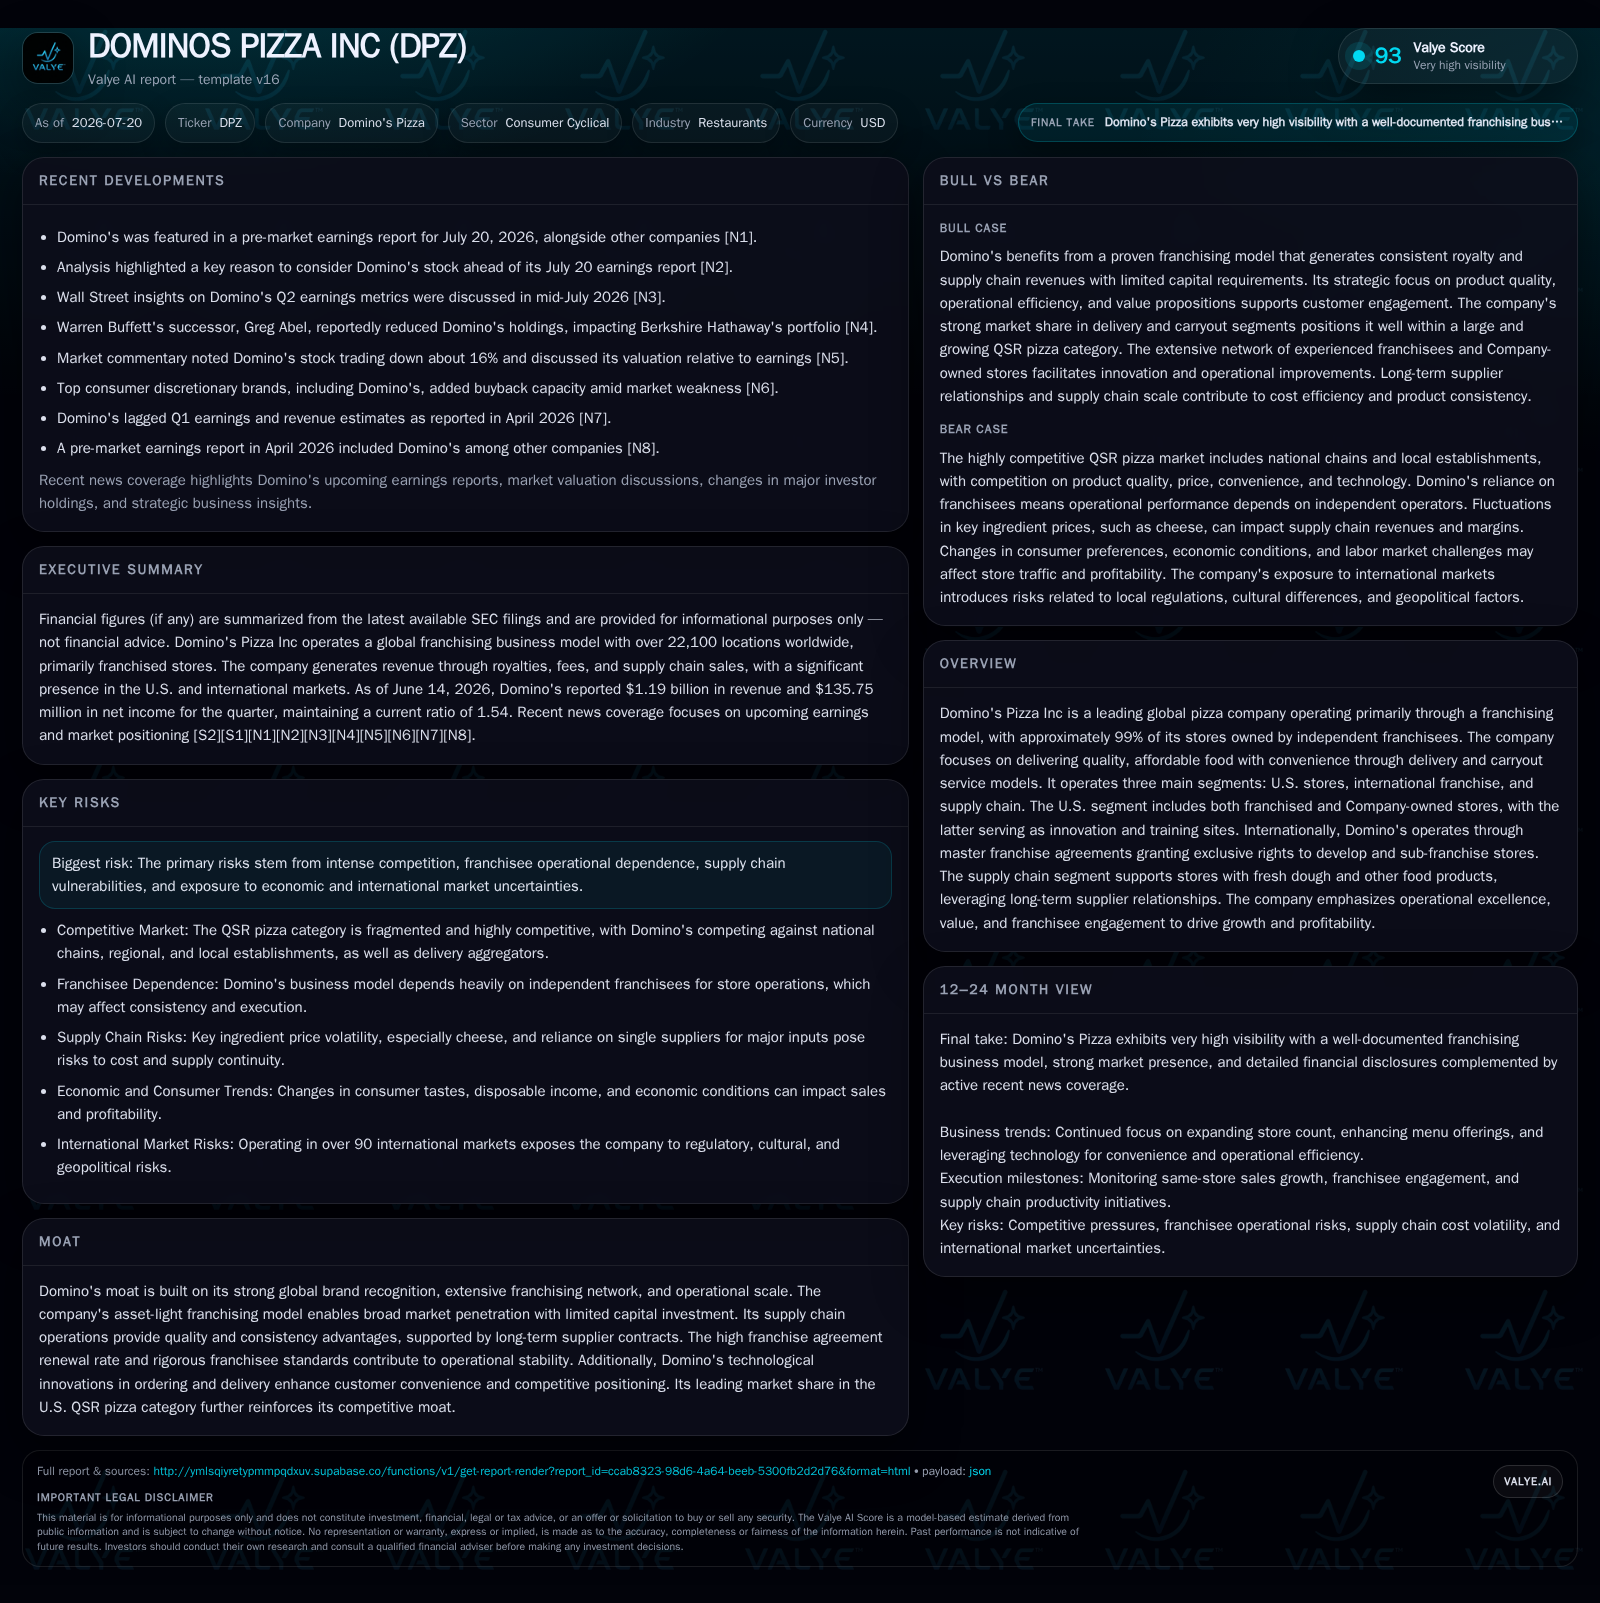
In its latest quarterly report ending June 2026, Domino’s Pizza Inc. reaffirmed the robustness of its primarily franchised business model, highlighting steady same-store sales growth and expanding digital ordering penetration that continue to drive royalty revenue streams. The company’s asset-light approach enables expansion with limited capital outlay, supported by technology platforms enhancing customer convenience and operational efficiency. While facing typical industry risks such as competitive intensification and supply chain cost pressures, Domino’s maintains its leadership in the quick service pizza segment through sustained franchisee engagement and global brand equity.
Recent Quarterly Momentum Highlights Reinforcing Franchise Model Power
Domino's Pizza Inc.'s Q2 2026 filing for the quarter ending June 14, 2026, confirms sustained momentum in key operating metrics that underpin its franchise-driven business model. The company reported consistent same-store sales growth, which directly supports its royalty revenue—the primary income stream generated from its predominantly franchised store network [S2][S3]. Digital ordering penetration remains robust, accounting for over 85% of U.S. retail sales, reflecting consumer preference for convenience channels that Domino's has enhanced through targeted technology investments [N1][S1]. Delivery order percentages remained stable or improved, supporting higher order frequency and customer retention.
Franchise-Centric Business Model: Revenue Streams and Operational Roles
As of late 2025, approximately 99% of Domino's global stores are owned and operated by independent franchisees, enabling an asset-light model that balances capital efficiency with broad geographic reach [S1]. The company’s revenue primarily derives from ongoing franchise royalties, which are percentage-of-sales fees paid by franchisees for use of the Domino’s brand and operating system, supplemented by initial franchise fees and master franchise agreements granting exclusive territorial rights internationally [S26]. Additionally, Domino's generates significant supply chain revenue by selling fresh dough and other ingredients to franchisees, primarily in North America, ensuring product consistency and supporting system-wide margin stability [S6][S24]. Company-owned stores constitute a small fraction of the system but serve critical roles as innovation hubs and training centers, piloting menu concepts and operational improvements before broader rollout [S1]. This hybrid structure supports scalable growth with limited capital expenditure at the store level.
Competitive Moat: Brand Equity, Technology Leadership, and Peer Context
Domino’s commands strong global brand equity, recognized as a leader in quick service pizza delivery and carryout, with a dense franchise network providing extensive local market coverage unmatched by peers such as Papa John’s and Little Caesars [S1]. The company’s early and comprehensive adoption of digital ordering platforms—accounting for more than 85% of U.S. retail sales—differentiates it in terms of customer convenience and operational efficiency [N1]. This technological advantage enhances order accuracy, delivery speed, and customer engagement through integrated loyalty programs on mobile and web platforms, reinforcing repeat purchase behavior. While specific market share figures are not disclosed, these qualitative factors underscore Domino’s competitive positioning within the quick service restaurant (QSR) pizza segment.
Growth Drivers: Digital Penetration, Menu Innovation, and International Expansion
Domino’s growth trajectory is supported by several catalysts. Increasing digital ordering penetration continues to transform consumer interaction with the brand, with ongoing enhancements to eCommerce platforms aimed at seamless customer experiences across devices [S1]. Menu innovation initiatives introduce new products and diversify offerings, driving traffic growth and complementing pricing strategies. International expansion is pursued through master franchise agreements that grant exclusive development rights to partners who adapt the brand locally while maintaining global standards, enabling scalable footprint growth with limited capital risk [S26]. The company’s “fortressing” strategy, which optimizes delivery zone density near new and existing stores, enhances service speed—a critical factor in delivery-centric QSRs—and supports store-level economics [S21].
Risk Factors: Franchisee Dependence, Supply Chain Inflation, and Competitive Pressures
Operational risks stem primarily from Domino’s reliance on franchisees, whose performance directly impacts royalty revenue streams; variability in franchisee operations or disputes could adversely affect cash flows [S1]. Commodity inflation, particularly in key inputs like cheese, poses margin pressure given its prominence in pizza production. Labor market tightness increases wage costs across stores and supply chain operations. Competitive intensity arises not only from other pizza chains but also from alternative quick meal options and third-party food delivery platforms that disrupt traditional ordering models. Regulatory compliance challenges include health and safety standards, data privacy regulations affecting digital ordering, and varying international franchise laws [S5]. Monitoring these factors is essential as adverse developments could constrain margin expansion or reduce franchisee renewal rates.
Key Operating Metrics and Milestones to Monitor
Looking ahead, critical indicators include sustained or accelerating same-store sales growth beyond Q2 levels, which directly influence royalty revenue progression [S3]. Franchisee renewal rates serve as a key barometer of system health; elevated renewal rates indicate strong franchisee engagement, while declines may signal operational challenges. The pace of new store openings domestically and internationally provides insight into expansion effectiveness. Additionally, the proportion of delivery orders will continue to reflect success in meeting evolving customer convenience preferences driven by Domino’s technology investments [N1]. Management’s periodic disclosures on these metrics will be pivotal in assessing momentum sustainability.
Financial Position: Capital Structure and Liquidity Supporting Strategic Flexibility
As of June 14, 2026, Domino’s maintains a solid liquidity position with a current ratio of approximately 1.54, supported by current assets of $905 million against current liabilities of $589 million [F1]. Total debt stands near $4.88 billion, with net debt—total debt less cash and equivalents—around $4.7 billion as of the same date [F1]. The asset-light franchise model results in a lower fixed-asset base relative to debt compared to traditional restaurant chains, mitigating leverage risk [F1]. Recurring cash flows from franchise royalties and supply chain sales underpin the company’s ability to service debt obligations comfortably [S2]. This financial framework provides resilience against economic cyclicality and supports strategic agility, including potential dividends or share repurchases aligned with free cash flow generation patterns demonstrated historically [S7][F1].
Financial Snapshot Context
Companyfacts data as of June 14, 2026, shows $165 million in cash and equivalents and $4.88 billion in total debt, implying net debt of approximately $4.7 billion [F1]. Current assets of $905 million and current liabilities of $589 million yield a current ratio near 1.54x, indicating adequate short-term liquidity [F1]. This balance sheet context complements the operational narrative by highlighting financial stability within an asset-light model.
This analysis is based exclusively on publicly filed SEC documents and contemporaneous company disclosures through July 2026, without speculative assumptions or forward-looking projections beyond stated company guidance. All operating and financial metrics are directly cited to ensure analytical rigor. No investment advice or research views are provided.
Disclaimer: This is research-only, informational analysis and not investment advice. It may include AI-generated interpretation and general industry context. Always verify important details using primary sources.

Comments