
Autoliv Strengthens Asia Sales Amid Manufacturing Restructuring and Margin Pressure
Autoliv’s Q2 2026 results show sales growth outpacing global light vehicle production in Asia, offset by restructuring costs and supply chain volatility.
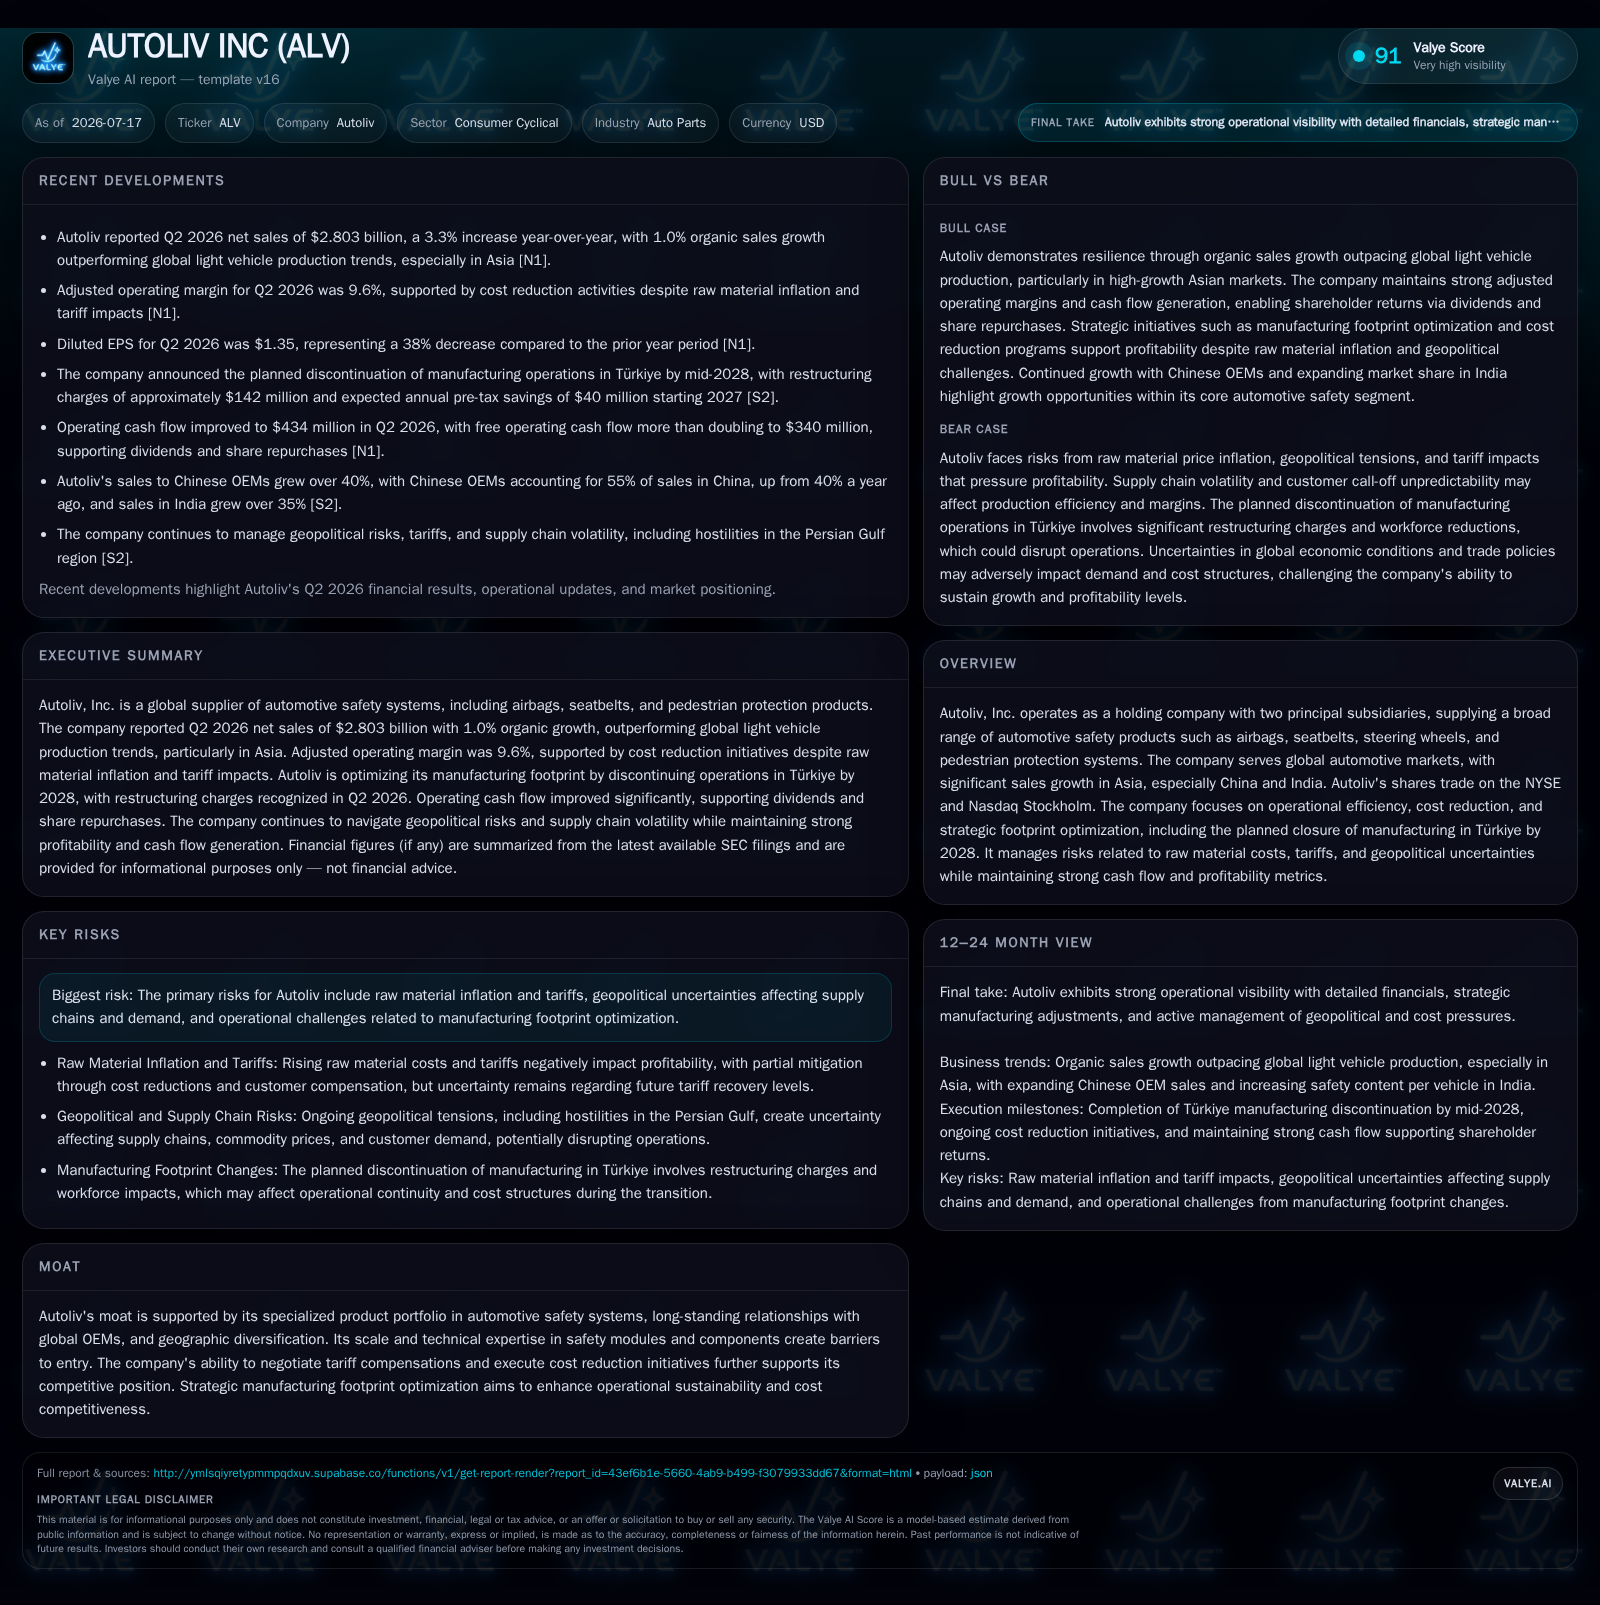
Autoliv Inc. reported organic sales growth of 1.0% in Q2 2026, outperforming the global light vehicle production decline of 0.3%, driven primarily by over 40% growth with Chinese OEMs and strong gains in India. Despite this, operating income declined due to restructuring charges associated with the announced closure of its manufacturing operations in Türkiye by 2028. The company continues managing tariff impacts and raw material cost pressures through customer compensations and operational footprint optimization. Cash flow generation remains robust, supporting ongoing shareholder returns despite margin headwinds.
Recent Operating Update
In its Q2 2026 filing on July 17th, Autoliv reported organic sales growth of 1.0%, notably outperforming the global light vehicle production (LVP) decline of approximately 0.3% during the same period [S2], [S5]. This top-line resilience was largely driven by the company’s strategic positioning in Asia where sales soared with Chinese OEMs by over 40%. Chinese OEMs now represent 55% of Autoliv’s sales in China versus only 40% a year ago—a shift anchored further by new cooperation agreements signed with Great Wall Motor and XPENG that solidify its competitive foothold [S2]. India also remains a bright spot with over 35% sales growth fueled by rising safety content per vehicle [S2].
Call-off order volatility continues as a persistent challenge. Although there was some improvement compared to mid-2025 levels, volatility remains above pre-pandemic norms primarily due to fluctuating demand signals from the Chinese market [S2]. Such unpredictability impacts Autoliv's production efficiency because call-off schedules drive manufacturing volumes tightly aligned with customers' LVP forecasts.
Adjusted operating income increased modestly by $8 million year-over-year due to gross profit improvements partly offset by increased R,D&E spending and SG&A costs [S2], reflecting ongoing investments in product development including mobility safety systems beyond traditional components. However, reported GAAP operating income took a hit from restructuring costs incurred in Türkiye and financial expenses linked to these changes, leading to a net decrease before taxes compared to the prior year [S2], [S12]. Adjusted operating margin rose slightly to 9.6%, demonstrating underlying operational leverage amidst inflationary pressures and currency headwinds.
Business Model
Autoliv operates primarily as a Tier 1 automotive parts supplier specializing in passive safety systems—modules like airbags (frontal, side-impact, curtain), seatbelts, steering wheels incorporating inflator technologies, and pedestrian protection products. Its clients are predominantly global original equipment manufacturers (OEMs), including Asian automakers rapidly expanding their market share.
Revenue flows from long-term supply contracts coupled with variable call-off orders matching OEM light vehicle production schedules. This model exposes Autoliv to fluctuations in LVP volumes but benefits from entrenched customer relationships requiring high regulatory compliance and technical expertise that create high switching costs.
The company has also invested strategically in diversifying into mobility safety solutions such as airbags for motorcycles and wearable airbag systems targeting niche segments beyond traditional passenger vehicles [S1], signaling an adaptation toward evolving mobility trends.
Autoliv's revenue metrics thus hinge on organic sales growth relative to LVP trends by geography—especially fast-growing markets like China and India—as well as market penetration among newer OEM entrants. Operating margins depend critically on cost containment amid raw material price inflation (e.g., steel, plastics), tariff regimes that require passing through costs or achieving compensations from customers (80%+ tariff recovery noted for previous years), operational efficiencies including production yield improvements and low call-off order volatility.
Industry Structure and Competitive Position
Within the automotive parts industry focused on safety components, Autoliv competes alongside other large Tier 1 suppliers such as Lear Corporation, ZF Friedrichshafen, and Continental AG—companies known for wide product portfolios addressing passive safety needs globally.
Its moat is supported by specialized design capabilities in airbags and seatbelts combined with geographic diversification—particularly rapid expansion in Asia—and the scale required to negotiate effectively on tariffs and absorb geopolitical shocks. Autoliv's supply chain complexity necessitates extensive regulatory certifications matched with just-in-time delivery models tied closely to OEM production schedules.
Operational footprint optimization efforts such as the Türkiye plant closure reflect industry-wide imperatives where suppliers consolidate capacity geographically based on regional demand outlooks and cost competitiveness metrics versus peers who may maintain higher fixed-cost footprints.
Customer concentration is partially mitigated through multiple OEM partners spanning Americas, Europe, China, and other Asian markets though elevated exposure remains where certain regional OEMs dominate local production volumes.
Growth Drivers
Organic growth prospects are underpinned strongly by increasing global light vehicle production especially across emerging markets like China and India where personal vehicle ownership rates continue rising. Furthermore:
- Safety content per vehicle is increasing universally owing to stricter regulations (e.g., pedestrian protection norms) and rising consumer preference for advanced passive safety features.
- The electric vehicle (EV) segment represents a growing part of Autoliv's portfolio—total EV-related sales estimated at $1.7 billion in 2025—requiring tailored airbag module adaptations given differing powertrain layouts [S1].
- Expansion into mobility safety beyond cars (motorcycles/bikes) diversifies revenue streams.
- Strategic alliances with fast-growing Chinese OEMs provide substantial new volume backlogs.
- Cost reduction initiatives fuel margin expansion potential amid inflationary pressures.
Risks and Constraints
Key risks include sustained raw material cost inflation which cannot be fully compensated through pricing given competitive dynamics; geopolitical tensions causing tariff uncertainties or supply chain disruptions; elevated call-off order volatility limiting manufacturing throughput efficiency; exposure concentrated regionally risking disproportionate impact from regulatory shifts or demand slowdowns; plus operational disruption risks arising from manufacturing footprint realignment notably Türkiye exit carrying upfront charges.
Currency fluctuations pose translation risk for international operations albeit partially hedged.
Additionally, technology shifts toward active safety systems may require continued R&D investment for relevance whereas failure to innovate could erode competitive positioning over time.
What To Watch Next
Financial Profile Discussion
As of June 30, 2026, Autoliv maintained robust liquidity with cash & equivalents totaling approximately $377 million alongside current assets near $4 billion against current liabilities close to $3.9 billion yielding a current ratio around 1.03 indicating balanced short-term solvency [F1]
Overall return metrics remain healthy with adjusted return on capital employed around mid-20%s indicative of effective capital utilization despite ongoing industry cyclicality pressures inherent due to reliance on automotive manufacturing movements globally.
This analysis synthesizes recent SEC filings emphasizing Autoliv’s evolving strategic posture within automotive passive safety components amidst cyclical automotive industry conditions amplified by geopolitical influences affecting supply chains and tariffs. It reflects no investment advice but provides sector-informed perspective grounded exclusively on cited disclosures from public documents.
Disclaimer: This is research-only, informational analysis and not investment advice. It may include AI-generated interpretation and general industry context. Always verify important details using primary sources.

Comments