
Davis Commodities Ltd Confronts Margin Pressures While Expanding FMCG Footprint
The latest quarter reveals ongoing margin compression and working capital challenges as Davis broadens into the FMCG sector amid volatile commodity markets.
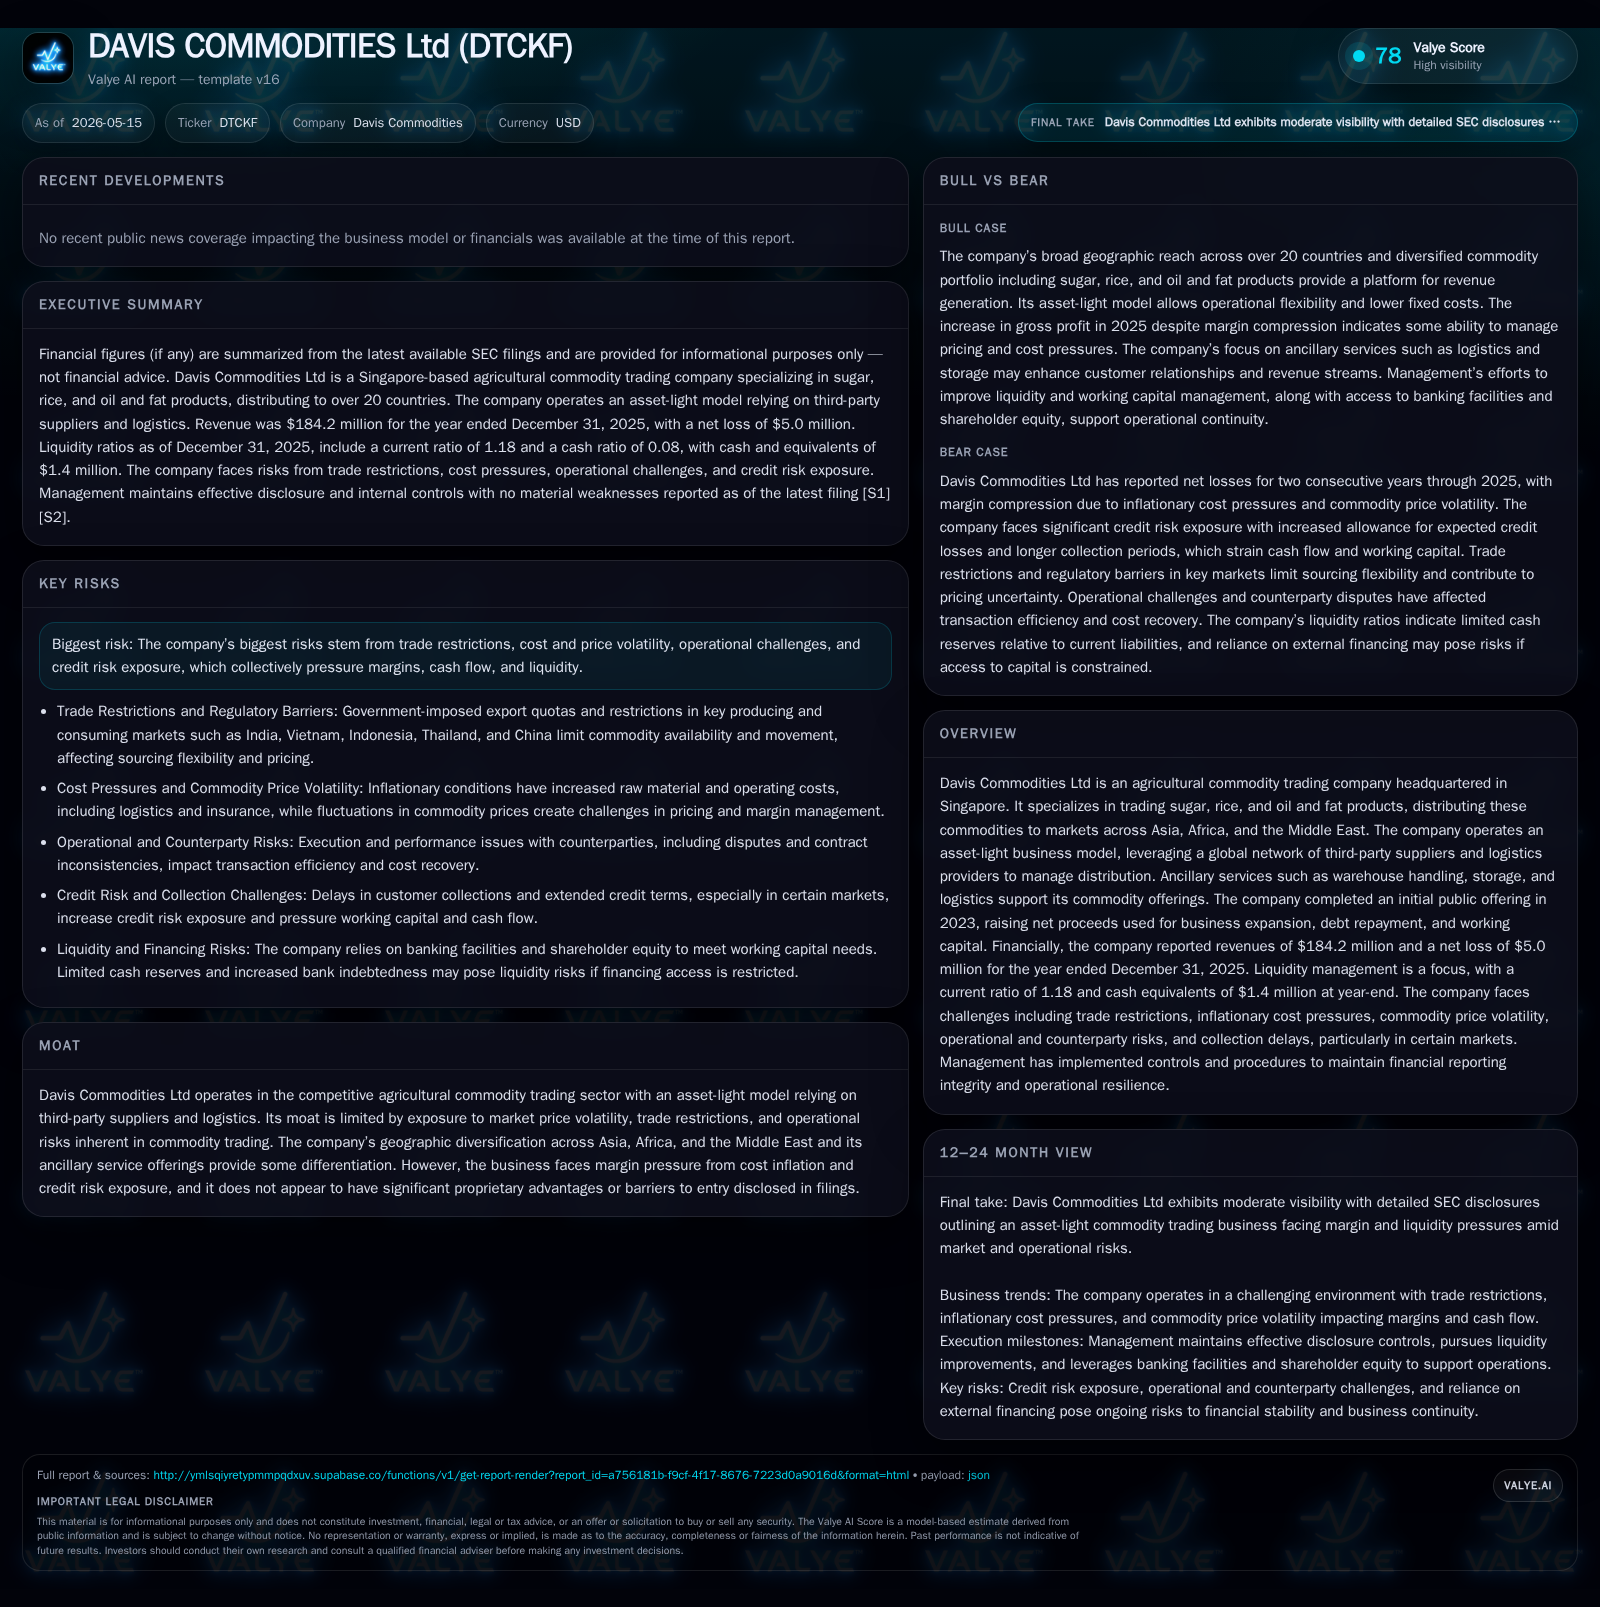
Davis Commodities Ltd's recent quarterly filings highlight sustained revenue growth contrasting with continued net losses and cash flow pressures driven by collection delays. The company follows an asset-light trading model across sugar, rice, and oil/fat products, now diversifying strategically into fast-moving consumer goods (FMCG) retail channels. Operating in competitive markets across Asia, Africa, and the Middle East, it navigates trade restrictions, cost inflation, and credit risk exposure. Its growth strategy hinges on geographic expansion and FMCG penetration, but execution risks and liquidity constraints remain key watchpoints.
Latest Quarterly Operating Update: Key Developments
Davis Commodities’ most recent Form 6-K filing dated May 15, 2026 ([S2]) confirms continued operational challenges amid an ongoing effort to stabilize margins and liquidity. Despite reporting revenue growth primarily from expanded activities in Africa and China during 2025 ([S1]), the Group recorded a net loss of approximately $5.0 million for the year ended December 31, 2025 ([F1],[S4]). Working capital management remains strained as collections from customers have slowed significantly, pushing accounts receivable to $10.7 million—a $3.0 million increase year over year—and fueling cash outflows of roughly $1 million from operations ([F1],[S6]).
Moreover, the company’s newly established fast-moving consumer goods (FMCG) segment began trading in Q4 2025 ([S1],[S15]). Though still in early development with reported start-up losses associated with marketing and distribution setup costs ([S1]), this initiative represents a strategic pivot designed to broaden Davis’s product mix beyond traditional commodities.
On the governance front, April saw a key board change reflecting enhanced oversight capabilities: Mr. Leyng Thai Weng resigned as Independent Non-Executive Director while Mr. Lim Chow Sheng was appointed to multiple board committees including Compensation Committee chair ([S3]). This infusion of director-level financial expertise may assist in navigating tighter margin scenarios and liquidity risks.
Business Model and Product Portfolio
Davis Commodities operates an asset-light model focused on trading three core agricultural commodities categories—sugar, rice, and oil & fat products—with revenues derived mainly from wholesale distribution via an established network spanning Asia, Africa, and the Middle East ([S1]). The company leverages third-party suppliers coupled with external logistics service providers to minimize fixed assets exposure while providing value-added ancillary services like warehouse handling and storage.
In 2025, sugar remained a significant revenue contributor but experienced margin erosion attributable to procurement cost inflation against competitive market pricing ([S11]). Conversely, rice trading posted improved gross profits thanks to favorable pricing dynamics and volume increases ([S11]). The oil & fat product segment witnessed decreased sales reflecting softer demand particularly outside core regions ([S1],[S11]).
The launch of the FMCG segment in late 2025 marks a notable shift aiming at retail-level penetration within local supermarkets across served geographies ([S1],[S15]). This unit is currently loss-making due to upfront investments but is positioned as a higher-margin complementary revenue stream intended to reduce dependency on cyclical commodity markets.
Industry Dynamics and Competitive Positioning
Davis Commodities operates within an intensely competitive global agricultural commodities trading landscape marked by volatility in commodity prices and substantial regulatory complexity ([S1],[S28]). Trade restrictions imposed by governments in India, Vietnam, Indonesia, Thailand, and China curtail sourcing options and inflate operational costs via export quotas or licensing hurdles ([S1],[S15]). Such layered controls hamper flexibility—especially acute given Davis’s broad yet shallow regional footprint.
Inflationary pressures exacerbate cost structures as logistics, freight charges, insurance premiums, and raw material expenses climb steeply ([S1]). These factors translate directly into margin compression that the firm has struggled to offset through pricing or efficiency gains. Notably absent are proprietary advantages such as exclusive supply contracts or technology differentiation; instead Davis relies on its geographic diversification—primarily strong positioning in African markets—and ancillary services to maintain competitiveness against peers ranging from regional traders to multinational commodity houses.
Growth Drivers: FMCG Expansion and Geographic Diversification
Two primary vectors underpin Davis’s growth ambitions: geographic market expansion focused on Africa and China; and diversification into FMCG retail channels starting late 2025 ([S1],[S15]).
Africa accounted for approximately 60% of total revenue in 2025 (~$110.5 million), representing robust year-over-year growth fueled by rising demand for sugar and rice products ([S15]). Simultaneously, China revenue more than tripled to $37.1 million due to increased market penetration facilitated by local partnerships ([S15]). Both regions offer structural tailwinds driven by population growth and evolving consumption patterns.
The nascent FMCG segment aims to leverage existing distribution frameworks for packaged consumer staples sold through supermarkets—a sector typically less sensitive to cyclical commodity price swings ([S1],[S15]). While early stage losses reflect required investments in product development, marketing campaigns, and channel partnerships ([S1]), management projects improved profitability as scale builds.
Nonetheless, Southeast Asian markets underperformed due to regulatory restrictions limiting import volumes (e.g., Indonesia import tenders not secured) or tightened trade policies impacting Vietnam and Thailand revenues sharply lower ([S15]). These setbacks underscore the uneven nature of regional expansion efforts.
Risks and Constraints: Pricing Volatility, Credit Exposure, and Regulatory Barriers
Price volatility across agricultural products remains a perennial challenge compressing Davis’s already thin gross margins (gross profit margin fell from 1.8% in 2024 to 1.6% in 2025 even with higher absolute gross profit) ([F1],[S11]). Inflation-driven cost escalations for procurement and logistics further erode profitability.
Regulatory risk abounds as export quotas or licensing requirements fluctuate unexpectedly across sensitive countries like India or China restricting supply chain agility ([S28],[S15]). These limitations potentially restrict volume throughput capacity during high-demand cycles.
Credit risk is pronounced since Davis extends credit without collateral or interest on trade receivables totaling over $10 million as of end-2025. Prolonged customer payment delays—particularly prevalent in African markets where extended terms are customary—strain working capital resources critical for operational continuity ([S5],[F1]). Notably, cash conversion cycles lengthened contributing materially to reported operating cash outflows (~$1 million annually) ([F1],[S6]).
Operational risks stemming from counterparties’ inconsistent contract fulfillment create transactional inefficiencies impacting margin recovery potential ([S1]). Lastly liquidity remains tight; despite some improvement post-IPO proceeds deployment largely towards debt repayment ($4.47 million net raise mainly allocated partly for working capital), current liabilities remain elevated against current assets evidenced by a current ratio of 1.18—a narrow cushion prone to stress if collections falter further ([F1],[S4],[S9]).
Near-Term Milestones and What to Watch Next
Key forthcoming indicators include:
- Collections performance trajectory: improvements here would relieve working capital pressure constraining cash flows [S4],[F1]
- Progress metrics within FMCG segment: market share gains among supermarket partners plus margin evolution will signal viability beyond initial losses [S1]
- Cost management effectiveness: inflationary headwinds require continued vigilance on procurement/logistics efficiencies [S11]
- Refinancing or banking facility renewals: access to external financing remains crucial; watch for announcements regarding terms or new credit lines [S9]
- Governance developments following new board appointments potentially bringing stronger oversight on compensation or audit areas [S3]
- Any regulatory changes affecting key sourcing countries that could materially impact supply chain dynamics [S28]
Financial Snapshot: Liquidity, Leverage, and Profitability
Latest financial snapshot
| Metric | Value | Period |
|---|---|---|
| Cash & equivalents | $1401000 | |
| 2025-12-31 | ||
| Total debt | $1581000 | |
| 2025-12-31 | ||
| Net debt | $180000 | |
| 2025-12-31 | ||
| Current assets | $21mm | |
| 2025-12-31 | ||
| Current liabilities | $18mm | |
| 2025-12-31 | ||
| Current ratio | 1.18x | |
| 2025-12-31 |
Source: SEC companyfacts cache [F1].
| Metric | Value (USD) |
|---|---|
| Revenue | 184.2 million |
| Net Income (Loss) | -5.0 million |
| Cash & Equivalents | 1.4 million |
| Total Debt | 1.58 million |
| Current Assets | 20.8 million |
| Current Liabilities | 17.65 million |
| Current Ratio | 1.18 |
As of December 31, 2025 data confirm moderate leverage with total debt near $1.58 million offset partly by $1.4 million cash resulting in low net debt around $180K ([F1]). Persistent net losses signal ongoing challenges balancing growth investments—particularly FMCG rollouts—and operating profitability under adverse sector conditions.
This analysis is based solely on reported filings through May 15, 2026 without any investment recommendations or forward-looking price forecasts. It aims to provide a clear understanding of Davis Commodities Ltd's current operating landscape including strengths, vulnerabilities, strategic initiatives, competitive environment insights, risk exposures, near-term milestones to monitor as well as a concise financial snapshot grounded in documented SEC disclosures.
Disclaimer: This is research-only, informational analysis and not investment advice. It may include AI-generated interpretation and general industry context. Always verify important details using primary sources.

Comments