
Eastman Chemical’s Q1 2026 Struggles Reflect Demand Softness Despite Innovation Edge
Declining volumes and prices weighed on Eastman’s first-quarter results, highlighting near-term headwinds against a backdrop of sustainable technology investments.
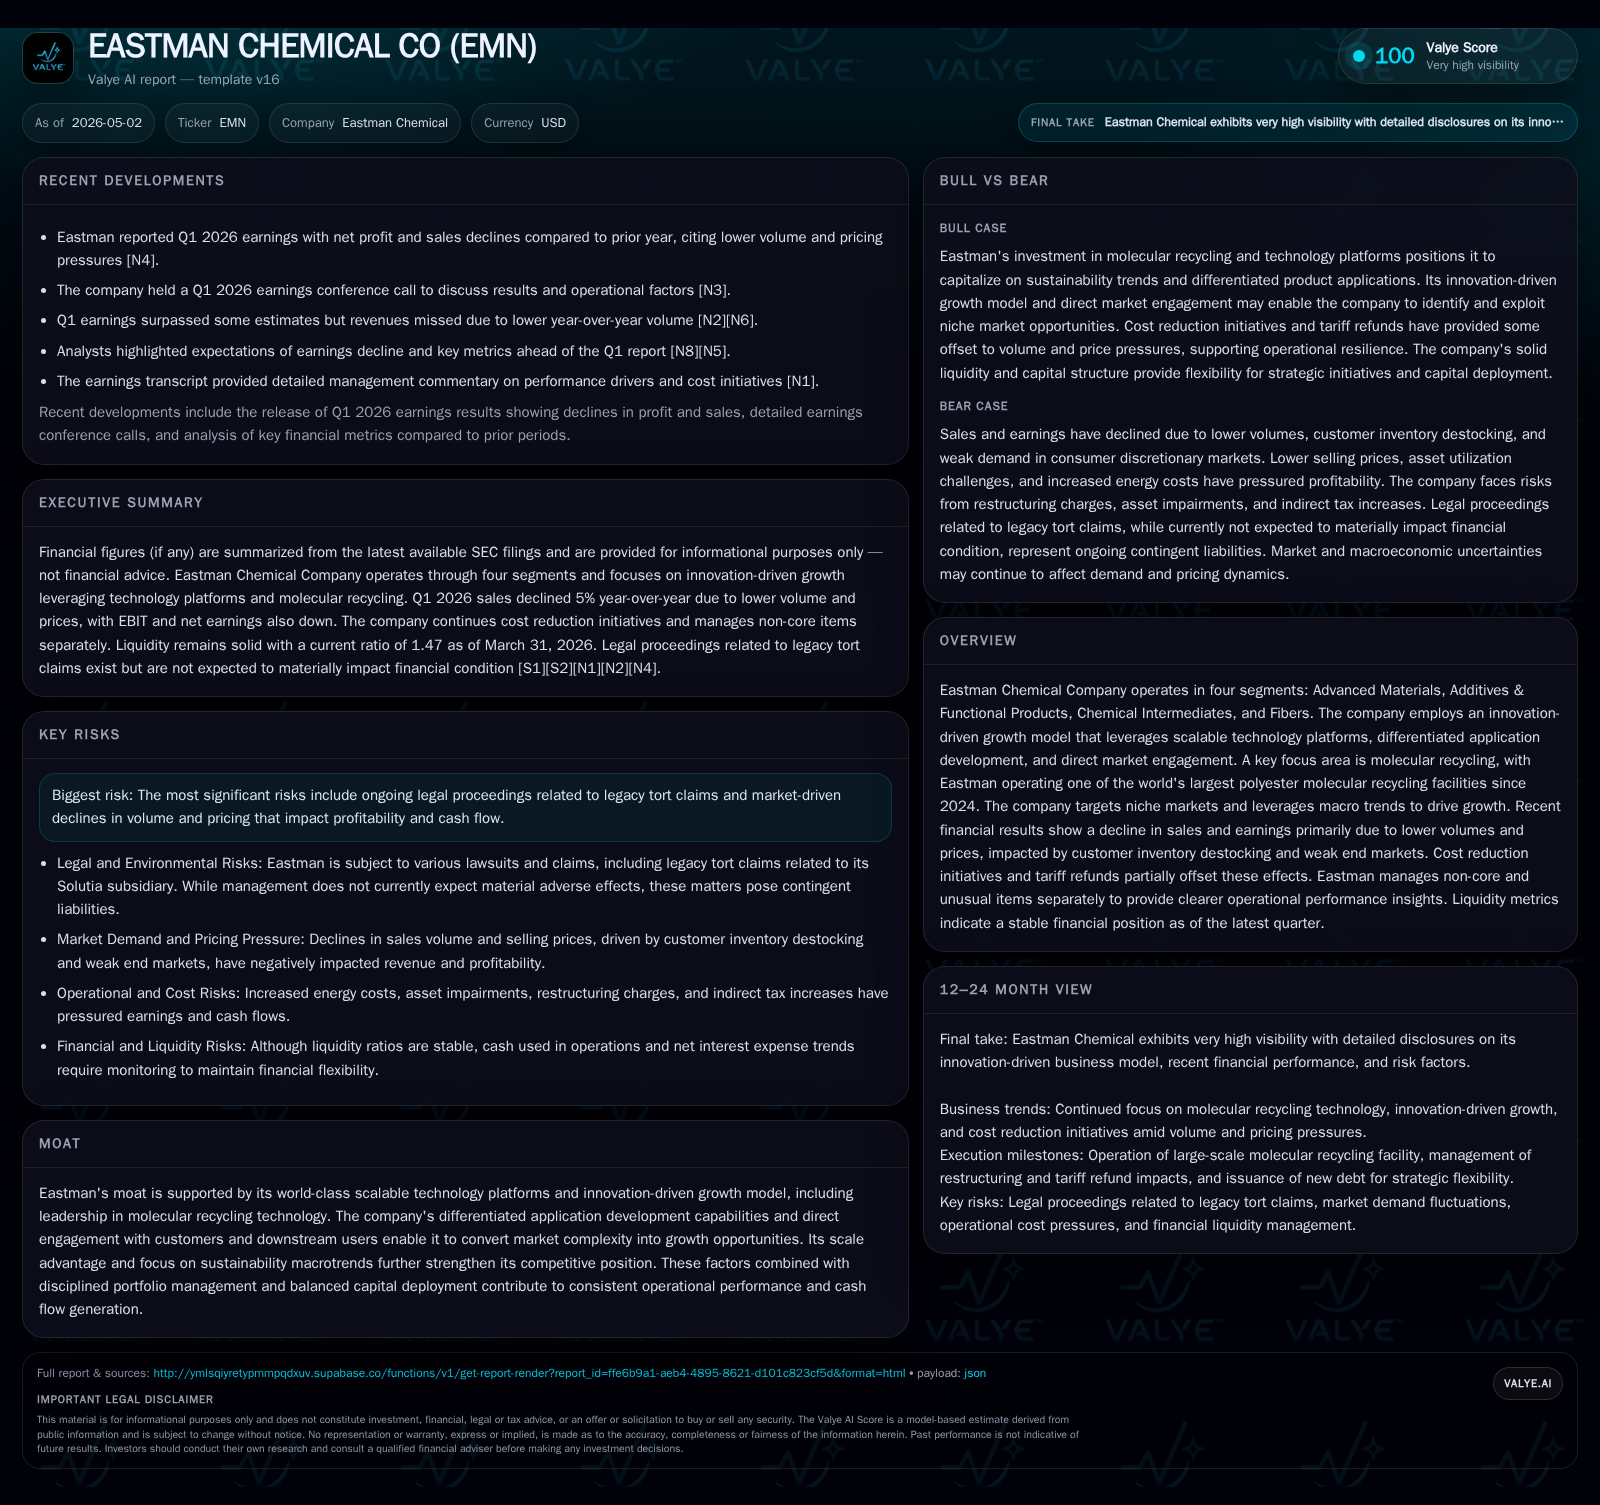
Eastman Chemical Company reported a 5% year-over-year sales decline in Q1 2026, chiefly driven by volume destocking in fibers and weaker demand in chemical intermediates amid challenging end markets. Despite pressure on earnings before interest and taxes (EBIT), ongoing investments in molecular recycling and differentiated application development underpin the company's innovation-focused growth strategy. Eastman’s scale and sustainability-oriented platforms provide competitive moats, though legal legacy tort claims and volatile commodity markets pose risks. The upcoming quarters will test restoration of volumes and pricing power as macroeconomic dynamics evolve.
Recent Operating Update
Eastman Chemical Company’s first quarter of 2026 paints a picture of operational strain set against longer-term innovation efforts. Reported net sales dropped by $113 million—or approximately 5%—to $2.18 billion compared to Q1 2025, primarily due to reduced selling volumes and lower average selling prices across the company’s four main segments: Fibers, Chemical Intermediates (CI), Advanced Materials (AM), and Additives & Functional Products (AFP) [S2][S7]. The volume shortfall was most pronounced in the Fibers segment where customer inventory destocking at the acetate tow product line—used predominantly in cigarette filters—and weakness in consumer discretionary-related end markets created top-line pressure. Concurrently, CI segment pricing softened amid lower raw material costs and persistent commodity headwinds.
EBIT showed an even steeper decline: from $302 million in Q1 2025 down to $188 million (a 38% decrease). Excluding non-core items such as restructuring charges totaling $12 million, adjusted EBIT fell by 36% year-over-year reflecting multiple headwinds including increased energy costs attributed to Winter Storm Fern disruptions, lower asset utilization across plants, and weak demand conditions. Management's discussion attributes partial relief to cost reduction programs and an expected refund of U.S. tariffs paid under the International Emergency Economic Powers Act (IEEPA) [S7][S8][S6].
Adjusted net earnings were $125 million or $1.09 per diluted share versus $222 million ($1.91 per share) a year prior—a material contraction evidencing the macroeconomic softness stressing operational leverage [S8][S11]. Cash used in operating activities narrowed slightly to $137 million from $167 million but still reflects ongoing working capital challenges.
Business Model
Eastman operates through four principal segments: Advanced Materials, Additives & Functional Products, Chemical Intermediates, and Fibers — each contributing distinct products embedded widely in industrial materials value chains. The core business model monetizes proprietary chemical technologies that transform raw feedstocks into specialty chemicals, engineered plastics, fibers, coatings intermediates, additives for diverse applications (textiles, packaging, automotive), and polymer intermediates.
A cornerstone of Eastman’s approach is its innovation-driven growth model which amplifies scalable technology platforms combined with deep—and often exclusive—application development capabilities tailored toward downstream customer needs across sectors such as automotive films, flexible packaging, personal care formulations, coatings, textiles, and specialty adhesives [S1][S21]. This direct engagement differentiates Eastman from commodity chemical producers by enabling closer conversion of market complexities into commercial opportunities.
Strategically significant is Eastman’s leadership in molecular recycling technology—particularly polyester molecular recycling—which leverages advanced chemolysis to convert plastic waste back into high-purity raw materials suitable for new polymer production without degradation limitations seen in mechanical recycling. The company operates one of the world’s largest polyester molecular recycling facilities since its commissioning in 2024; this commitment not only aligns with global sustainability imperatives but also represents a potentially durable competitive advantage given increasing regulatory emphasis on circular plastics [S1][S21].
Revenue mechanics depend heavily on sales volumes dictated by end-market demand cycles (notably consumer packaged goods, automotive weight reduction trends, electronics), pricing shaped by feedstock costs plus value differentiation through innovation outputs, and channel engagement that fosters co-development partnerships enhancing switching costs.
Margins vary by segment but benefit from scale advantages, product mix skewed toward niche specialty chemicals rather than bulk commodities, operational efficiencies driven through cost initiatives launched consistently over recent years, and tariff mitigation strategies leveraging applicable regulatory frameworks like IEEPA refund claims [S7][S6].
Industry Structure and Competitive Position
Eastman sits within the chemical specialities industry—a sector characterized by high technical barriers due to required proprietary chemistries, extensive R&D investments for new applications development, environmental compliance burdens, and complex global supply chain demands. This industry structure favors companies capable of continuous innovation combined with scale economies.
Competitively Eastman benefits from four pillars: its scalable patented platforms especially molecular recycling technologies; breadth spanning additives to fibers enabling diversified exposure; differentiated application development focused on customer collaboration; and sustainability leadership meeting rising ESG standards.
However, competition includes diversified global chemical players like BASF, LyondellBasell (noted for commodity polymer strength), and specialty intermediates producers pressing innovation fronts. Cost pressures from feedstock volatility coupled with shifting trade policies dynamically influence competitiveness.
Eastman’s acquisition history— notably Solutia integration—has broadened portfolio scope but also carries legacy litigation exposure posing reputational and financial risk factors [S29].
Growth Drivers
- Innovation Pipeline: Continued R&D focusing on expanding molecular recycling capacity/products coupled with advancing high-performance materials for packaging light-weighting support structural growth.
- End-Market Expansion: Targeting niche attractive markets within automotive films (for weight reduction), flexible packaging driven by e-commerce expansion, personal/home care formulations optimized for sustainability regulations.
- Application Development: Technical collaboration intensifies customer stickiness; success here translates into improved price realization vs. commoditized peers.
- Geographic Reach & Sustainability Trends: Leveraging presence across Americas, Europe & Asia to capitalize on increasing regulation favoring recycled content along with stronger ESG buyer preferences.
- Cost Reduction Programs: Operational excellence initiatives aimed at manufacturing efficiency underpin margin preservation even amid cyclic softening phases.
Risks / Watchpoints / Growth Constraints
- Demand Cyclicality: Exposure to consumer discretionary markets means revenues can be volatile based on macroeconomic conditions—including inflationary pressures suppressing manufacturing activity leading to lower fiber consumption.
- Pricing Pressure & Raw Material Volatility: Feedstock cost fluctuations coupled with customer bargaining power constrain pricing power; weak commodity markets challenge parts of CI segment margins.
- Legacy Litigation: Ongoing Solutia-related legacy tort claims introduce contingent liabilities which could impact financial flexibility should unforeseen adverse rulings occur [S29].
- Energy Supply Risks: Recent spikes caused by weather extremes demonstrated vulnerability to energy cost inflations impacting operational costs substantially.
- Execution Risk: Scaling up molecular recycling commercially poses technological complexity; failure could delay returns or investment breakeven timelines.
What to Watch Next
Key milestones include:
- Quarterly monitoring of volume trends particularly within acetate tow/Fibers segment as customer inventory adjustments normalize post-destocking episodes;
- Progress updates on molecular recycling capacity expansions or downstream product launches;
- Trajectory of pricing recovery aligned with raw material market shifts;
- Cost reduction initiative efficacy reflected via margin stability metrics;
- Regulatory developments impacting recycled content mandates globally which may accelerate demand shifts toward Eastman's solutions;
- Legal developments connected to Solutia litigations impacting contingent risk assessments;
- Subsequent quarterly earnings reports for any signs of stabilization or improvement in EBIT performance relative to current depressed base levels.
Financial Profile Contextualized Briefly
Latest financial snapshot
| Metric | Value | Period |
|---|---|---|
| Cash & equivalents | $566mm | |
| 2025-12-31 | ||
| Current assets | $4.1bn | |
| 2026-03-31 | ||
| Current liabilities | $2.8bn | |
| 2026-03-31 | ||
| Current ratio | 1.47x | |
| 2026-03-31 |
Source: SEC companyfacts cache [F1].
Eastman's liquidity position appears stable entering mid-2026: current assets stand at approximately $4.06 billion versus current liabilities near $2.77 billion yielding a current ratio close to 1.47 which suggests reasonable short-term solvency [F1]. Net debt approximates $3.69 billion when considering available cash balances just above half a billion dollars as of late December 2025 [F1]. Interest expense was stable around $52 million net in Q1 reflecting effective capital management given debt obligations outstanding since early 2010s notes issuance events [F1][S16][S17].
While net earnings contracted sharply sequentially ($107 million versus $182 million year prior), management’s disclosure around adjusted metrics that exclude restructuring charges and unusual tax-related items help contextualize operating performance trends more accurately [S8][S11]. Cash outflows remain notable but show slight improvement quarter-on-quarter highlighting working capital management amid slower sales.[F1]
Overall cash flow generation capability will remain pivotal amid volatile external environment requiring funding for capex tied to innovation infrastructure expansion including molecular recycling scaling efforts [S1][N1].
Disclaimer: This analysis provides an objective operational assessment based solely on cited SEC filings and disclosed corporate information as of May 2026 without offering investment advice or price forecasts.
Disclaimer: This is research-only, informational analysis and not investment advice. It may include AI-generated interpretation and general industry context. Always verify important details using primary sources.
Comments