
Segment Profitability and Balance Sheet Strength Mark Energy Services of America’s Q3 Update
Energy Services of America reports broad-based segment gains and prudent liquidity management in its latest quarter, reflecting operational resilience amid sector cyclicality.
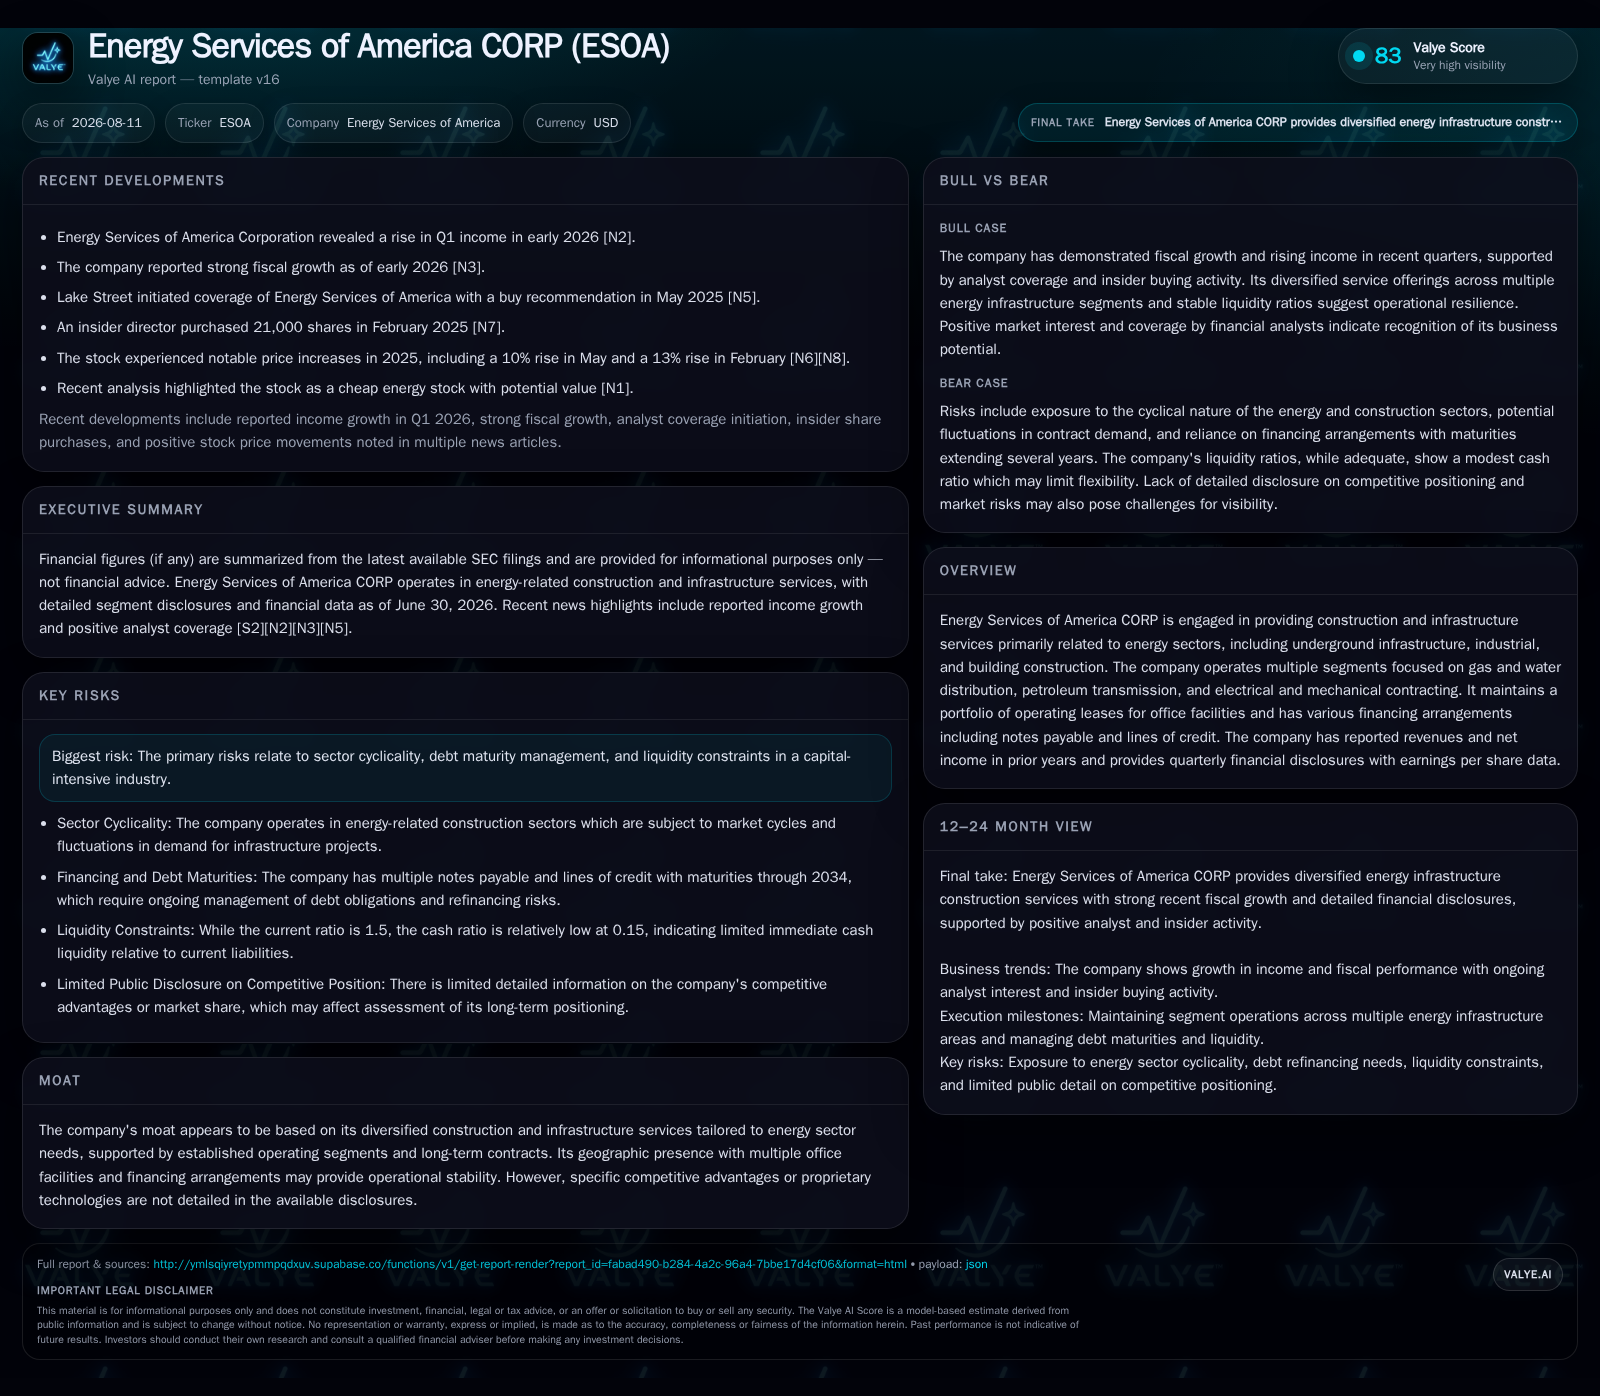
Energy Services of America's third-quarter results demonstrate meaningful revenue growth driven by improvements across its Underground Infrastructure, Industrial, and Building Construction segments. The company's strategy of leveraging long-term contracts sustains backlog stability, supporting near-term revenue visibility despite cyclical pressures in the energy infrastructure sector. Operational efficiency initiatives appear to enhance segment operating margins, while a solid liquidity position with a current ratio around 1.5 and net cash surplus mitigates refinancing risks inherent to the capital-intensive business. Key challenges remain related to debt maturities and project execution risks, emphasizing the importance of backlog conversion and contract awards in upcoming quarters.
2026 Q3 Operating Momentum Bolstered by Diverse Segment Gains
Energy Services of America CORP delivered an encouraging operational update for the third quarter ended June 30, 2026, with consolidated revenues rising to approximately $130 million from roughly $104 million year-over-year [S2]. This uplift was underpinned by a balanced contribution across its three main business units: Underground Infrastructure Construction, Industrial Construction, and Building Construction. Industrial Construction notably registered improved profitability, while the Underground Infrastructure segment narrowed previous operating losses, signaling effective scaling of operating leverage within this capital-intensive service portfolio.
The President’s role as chief operating decision maker involves continuous monitoring of segment operating income versus forecasts for capital allocation decisions — a discipline that appears to be paying off given the higher consolidated operating margin of around 2% compared to prior periods [S2]. The result reflects not only increased volume but also enhanced contract profitability dynamics within the company's long-term contracts framework.
Capturing Stability: Backlog Quality and Contract Structure Analysis
A critical pillar sustaining ESOA's growth narrative is its backlog composed primarily of long-term contracts with natural gas utilities, petroleum distributors, water authorities, and industrial customers [S1], [S2]. These contracts generally exhibit lump sum or cost-plus billing arrangements with progress-based revenue recognition models aligning payments to project milestones or costs incurred.
This structure provides ESOA sufficient near-term visibility into project pipelines amidst sector cyclicality driven by commodity prices and regulatory investment timing. Management commentary highlights steady backlog replenishment during Q3 [S2], which mitigates the common volatility seen among peer contractors whose revenue depend heavily on spot project awards. The presence of internal subcontracting between segments further aids internal resource optimization, blurring some traditional silo effects often seen in multi-segment firms.
Operational Efficiency: Equipment Utilization and Margin Dynamics
Operational metrics implicit in segment financial disclosures indicate improvement in equipment utilization rates—a core KPI given ESOA’s capital-intensive asset base including heavy machinery essential for pipeline trenching and site preparation work [S1], [S2]. Depreciation expense rose substantially reflecting ongoing investments or asset base expansion ($10 million depreciation for nine months ended June 2026) but remains matched by proportional revenue scaling [S2].
Segment gross profit margins reflect this progression: Industrial Construction posted a strong ~13.7% gross margin with positive operating income contribution; Underground Infrastructure margins improved though still below breakeven at roughly 9.4%, highlighting ongoing cost absorption as scale builds [S18]. Such margin variability is consistent with industry norms where underground pipeline construction faces acute regulatory compliance costs and weather-related execution challenges.
Labor productivity and safety measures are unreported explicitly but are likely focal points given stiff competition among regional infrastructure providers aiming to safeguard margins amid commodity-linked client budgets.
Market Position Benchmarked with Peers Driven by Multi-Segment Penetration
While ESOA operates mainly in mid-Atlantic and central U.S., its multi-segment approach—spanning underground infrastructure projects through building construction—provides diversification not often matched by smaller regional contractors focused solely on pipeline or utilities work [S1], Industry Knowledge Layer. Peer companies like Quanta Services or MasTec exemplify scaled multi-segment models serving broad energy infrastructure needs; though ESOA is smaller scale, it benefits similarly from cross-segment client relationships that enhance contracting leverage.
However, this regional footprint does concentrate risk regarding local economic cycles and regulatory environments that influence public infrastructure spending. Additionally, competitive pricing dynamics pressure contractor margins especially on lump sum contracts where unforeseen execution costs impair profitability.
Growth Catalysts: Infrastructure Modernization and Regulatory Compliance Initiatives
Structural tailwinds supporting ESOA’s growth stem from heightened regulatory focus on pipeline safety mandates following recent legislative actions targeting aging natural gas distribution systems. These programs increase demand for rehabilitation and replacement projects underpinning backlog inflows.
Simultaneously, investments into urban water distribution networks and environmentally compliant industrial facility upgrades create complementary avenues for ESOA's building construction segment to capture incremental market share. Management references newly awarded contracts related to such initiatives in the recent event filing [S3], reinforcing the company's alignment with these macro drivers.
Emerging renewable energy distribution infrastructure requiring specialized underground construction services represents a potential medium-term growth vector that could diversify ESOA’s end-market dependence beyond traditional hydrocarbons.
Watchpoints: Debt Maturity, Liquidity Pressure, and Cyclicality Sensitivities
Despite progress operationally, ESOA’s balance sheet reflects typical stresses for capital-intensive contractors: notes payable due between mid-2026 through late-decade require careful refinancing planning [S2]. While total debt is estimated at about $10.3 million based on available historical data adjusted cautiously [F1], cash balances approach $14.7 million as of quarter-end June 2026 resulting in net cash surplus—a rare comfort supporting liquidity [F1].
The current ratio near 1.5 signals adequate short-term coverage however reliance on lines of credit and operating leases demands continued prudent working capital controls especially through periods of uneven project completion or payment receipts volatility common in construction sectors [F1]
Sector cyclical downturns could delay new contract awards or compress client budgets challenging backlog maintenance. Equipment obsolescence risk also necessitates sustainable capex funding without overleveraging.[S2],[F1]
Upcoming Catalysts: Contract Awards, Backlog Updates, and Execution Indicators
Critical near-term milestones include quarterly disclosure updates on new contract awards which will signal success in replenishing backlog amid competitive bidding environments [S3]. Backlog-to-revenue conversion rates will remain key metrics to watch as they validate how effectively ESOA translates booked work into recognized income.
Segment profitability trends next quarter will indicate either maintenance of operating margin gains or erosion under project complexity or cost inflation pressures. Monitoring changes in indirect expenses including corporate overhead can also flag efficiency initiatives' effectiveness or escalating fixed cost absorption issues.
Financial Profile Discussion: Balancing Capital Intensity With Stability
Assets are largely current asset dominated ($149 million) with liabilities slightly lower ($99 million) yielding a healthy current ratio around 1.5 as per latest balance sheet snapshots [F1]. The debt burden at roughly $10 million is manageable against cash reserves implying a net debt negative position bolstering credit flexibility despite capital expenditure needs intrinsic to asset-heavy operations.
This financial footing enables continued investment into core segments without overt distress while mitigating refinancing risk on notes payable maturing over the next four years.[S2],[F1]
This analysis synthesizes Energy Services of America CORP's recent operational disclosures against industry context highlighting how segment-level profitability improvement combined with financial prudence positions the company to navigate inherent cyclicality and capital intensity challenges in energy infrastructure construction. Key execution risks revolve around backlog conversion efficiency plus maintaining liquidity under evolving project demand conditions. Subsequent quarterly reports will provide vital indicators validating progress toward scalable margin expansion and sustainable growth trajectories.
Disclaimer: This report is for informational purposes only and does not constitute investment advice or research view.
Disclaimer: This is research-only, informational analysis and not investment advice. It may include AI-generated interpretation and general industry context. Always verify important details using primary sources.

Comments