
EVgo's Strategic Partnerships Drive Market Reach amid Profitability Pressures
EVgo posted Q1 2026 revenue beats despite ongoing losses, reflecting the dual challenge of scaling its nationwide fast charging network while managing operational expenses.
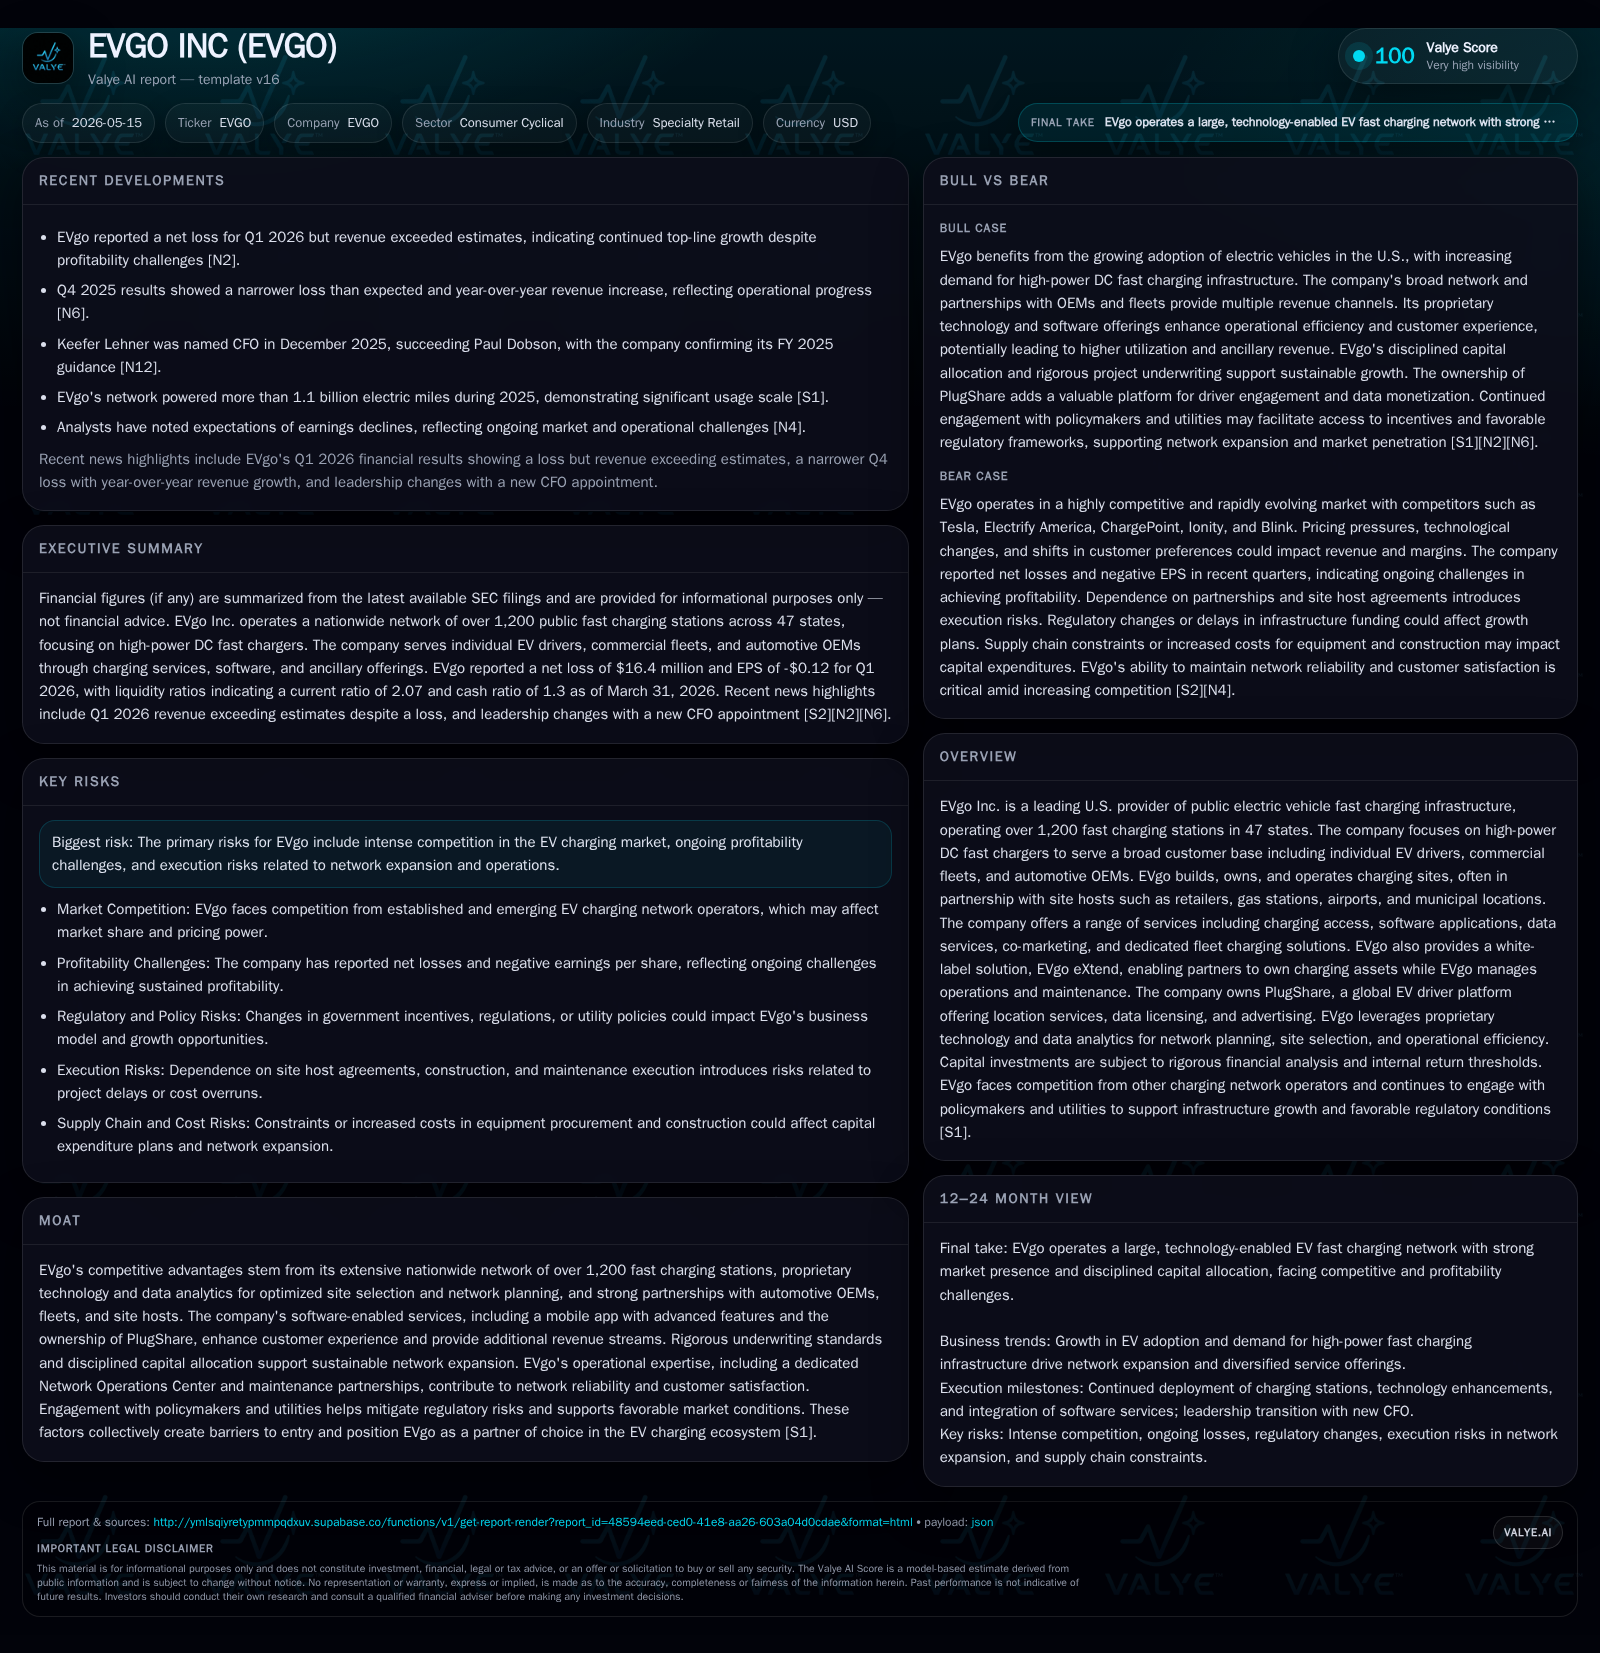
In Q1 2026, EVgo outperformed revenue expectations driven by expanding utilization across its network of over 1,200 DC fast chargers. The company’s vertically integrated model combines asset ownership, strategic partnerships with OEMs and site hosts, and proprietary software platforms such as PlugShare to capture diverse revenue streams. However, persistent operating losses underscore profitability risks amid rising competition and capital-intensive expansion. EVgo’s strong liquidity position supports continued deployment and product innovation, with upcoming execution milestones focused on fleet engagements and enhanced customer experience through technology.
Latest Quarterly Operating Highlights and What They Reveal
In its Q1 2026 10-Q filing dated May 5, EVgo reported revenues exceeding analyst forecasts despite sustaining net losses for the period [S2][N2]. This topline strength is attributable primarily to utilization growth across its fast charging network alongside an expanded station footprint. However, the persistence of negative operating income illustrates that the company is still navigating the typical capital- and maintenance-intensive phases of infrastructure expansion. The simultaneous press release via Form 8-K reiterated these points while outlining confidence in long-term demand fundamentals despite near-term earnings pressures [S3][N1]. This juxtaposition of revenue beats during continuing losses sets the tone for understanding EVgo's dual challenge: scaling capacity rapidly while treading carefully on operational efficiency.
EVgo’s Business Model: Infrastructure Ownership, Partnerships, and Software Services
EVgo’s core business revolves around building, owning, and operating a robust public fast charging network exceeding 1,200 stations across 47 states chiefly equipped with high-power DC fast chargers suited for heavier EV models like SUVs and pickups [S1][S5]. Revenues emanate from multiple sources: direct charging transactions by individual drivers; negotiated contracts with automotive OEMs who seek reliable charging access for their customers; fleet customers reliant on dependable depot or hub-based charging; along with a white-label approach called EVgo eXtend where partners own the physical assets but outsource operations to EVgo for seamless network integration [S11].
Accompanying this physical infrastructure is a suite of proprietary software products including a mobile app offering plug-and-go features like Autocharge+, charging reservations, payment processing (EVgo Access), alongside B2B portals serving partners such as automakers and site hosts—streamlining network visibility and operational management [S15]. Notably owned subsidiary PlugShare enhances consumer engagement by providing global charger location data services plus advertising inventory monetization opportunities for institutional clients [S18]. This multi-layered business model captures volume-driven revenues while adding higher-margin digital services that could improve overall unit economics over time.
Competitive Positioning in a Rapidly Evolving EV Charging Industry
The U.S. public DC fast charging market is fiercely competitive with incumbents like Tesla’s Supercharger network commanding loyal users alongside Electrify America’s aggressive buildout and ChargePoint’s extensive footprint [S13]. Despite this rivalry, EVgo holds defensible moats through scale — targeting deployment in highly trafficked urban/suburban corridors optimized by proprietary GIS-based analytic tools guiding site selection based on fleet routes, traffic density, local incentives and user demand projections [S12]. Furthermore, strategic alliances with leading OEMs (GM, Honda) bolster captive customer flows while relationships with prominent retail site hosts unlock premium real estate access.
EVgo's investment in software-enabled services differentiates its value proposition by enhancing user experience (e.g., plug-and-go convenience) while deepening partner engagement through API integrations (EVgo Inside). Operational competencies such as maintaining a dedicated Network Operations Center enable real-time diagnostics enhancing reliability—one of the key competitive factors given how downtime erodes customer loyalty in this nascent industry segment [S4].
Growth Drivers: Network Expansion, Fleet Solutions, and Technological Innovation
A key tailwind driving volume growth is accelerating battery electric vehicle (BEV) penetration estimated at roughly 7.5% of new vehicle sales in 2025 with approximately 5.7 million BEVs on U.S. roads at year-end ahead of further penetration gains projected for subsequent years due to declining total cost of ownership (TCO) advantages and model availability expansion across vehicle segments including larger SUVs/pickups requiring more powerful chargers [S1].
Commercial electrification adds another layer of demand particularly among rideshare fleets which require reliable growing DC fast charger access optimized for high throughput schedules. EVgo's dedicated fleet solutions coupled with off-site hubs translate into volume commitments often supported by a mix of fixed/variable payment contracts mitigating usage volatility risk [S21].
Technology innovations such as Autocharge+ simplify the customer journey by automating session initiation which can increase frequency per user while PlugShare broadens addressable markets via global app adoption combined with B2B data monetization. The white-label eXtend platform also acts as an asset-light growth catalyst enabling partners to capitalize on network effects without incurring full build-operate risks themselves [S11].
Risks and Constraints: Profitability Challenges and Market Competition
With continuing net losses highlighted in Q1 results alongside steep capital expenditures for station construction/maintenance plus technology development costs reflecting an early-stage infrastructure play—ongoing profitability challenges remain existential risks should cost structures fail to converge favorably or volume ramps slow materially relative to spending pacing.
Competitive pricing pressure remains acute especially given larger players’ market positions raising potential subsidy capture battles or localized pricing wars which could erode margins at existing stations. Execution risk also arises around maintaining high uptime standards critical for avoiding driver churn given competitor alternatives readily available nearby—complex maintenance logistics compounded by site host coordination amplify these challenges. Additionally regulatory uncertainty—particularly shifts in government incentives or utility rate policies—could introduce variability into project economics impacting returns on deployed capital [S6][N2].
Key Upcoming Milestones and What Investors Should Watch
Near-term key performance indicators center around measured increases in active station count coupled with improved utilization rates reflecting successful location targeting informed by proprietary planning tools [S2][N1]. The ramping of the EVgo eXtend platform rollout exemplifies potential accelerants if partner onboarding expands significantly across new geographies.
Further OEM contract renewals or additions serve as indicators of sustained demand confidence while enhancements within the mobile app ecosystem—such as broader deployment of Autocharge+ or additional reservation features—signal progressing customer experience improvements potentially translating into higher repeat usage rates [S3]. Monitoring operational metrics related to network uptime percentage will be critical given their direct link to reputational strength amidst stiff competition.
Financial Snapshot: Liquidity, Capital Structure, and Revenue Trends
Latest financial snapshot
| Metric | Value | Period |
|---|---|---|
| Cash & equivalents | $122mm | |
| 2026-03-31 | ||
| Total debt | $212mm | |
| 2026-03-31 | ||
| Net debt | $89mm | |
| 2026-03-31 | ||
| Current assets | $239mm | |
| 2026-03-31 | ||
| Current liabilities | $116mm | |
| 2026-03-31 | ||
| Current ratio | 2.07x | |
| 2026-03-31 |
Source: SEC companyfacts cache [F1].
| Metric | Value (USD) |
|---|---|
| Cash & Equivalents | 122435000 |
| Total Debt | 211525000 |
| Net Debt | 89090000 |
| Current Assets | 239240000 |
| Current Liabilities | 115672000 |
| Current Ratio | 2.07 |
As reflected in Q1 ending March 31 balances reported via companyfacts data verified in SEC filings [F1], EVgo maintains over $122 million cash reserves offsetting $212 million total debt yielding manageable net leverage about $89 million. While losses remain embedded within operating income statements reflecting normal scale-up dynamics typical to infrastructure rollouts in early commercialization phases (operating income recent annual figure -$110.7 million) profitability trajectories likely depend heavily on volume growth surpassing fixed/sunk cost bases over time.
Disclaimer: This is research-only, informational analysis and not investment advice. It may include AI-generated interpretation and general industry context. Always verify important details using primary sources.

Comments