
Exponent Inc’s 2025 Growth Moderates on Demand Variability and Cost Pressures
Specialized multidisciplinary consulting delivers steady revenue gains amid client demand shifts and rising operational costs.
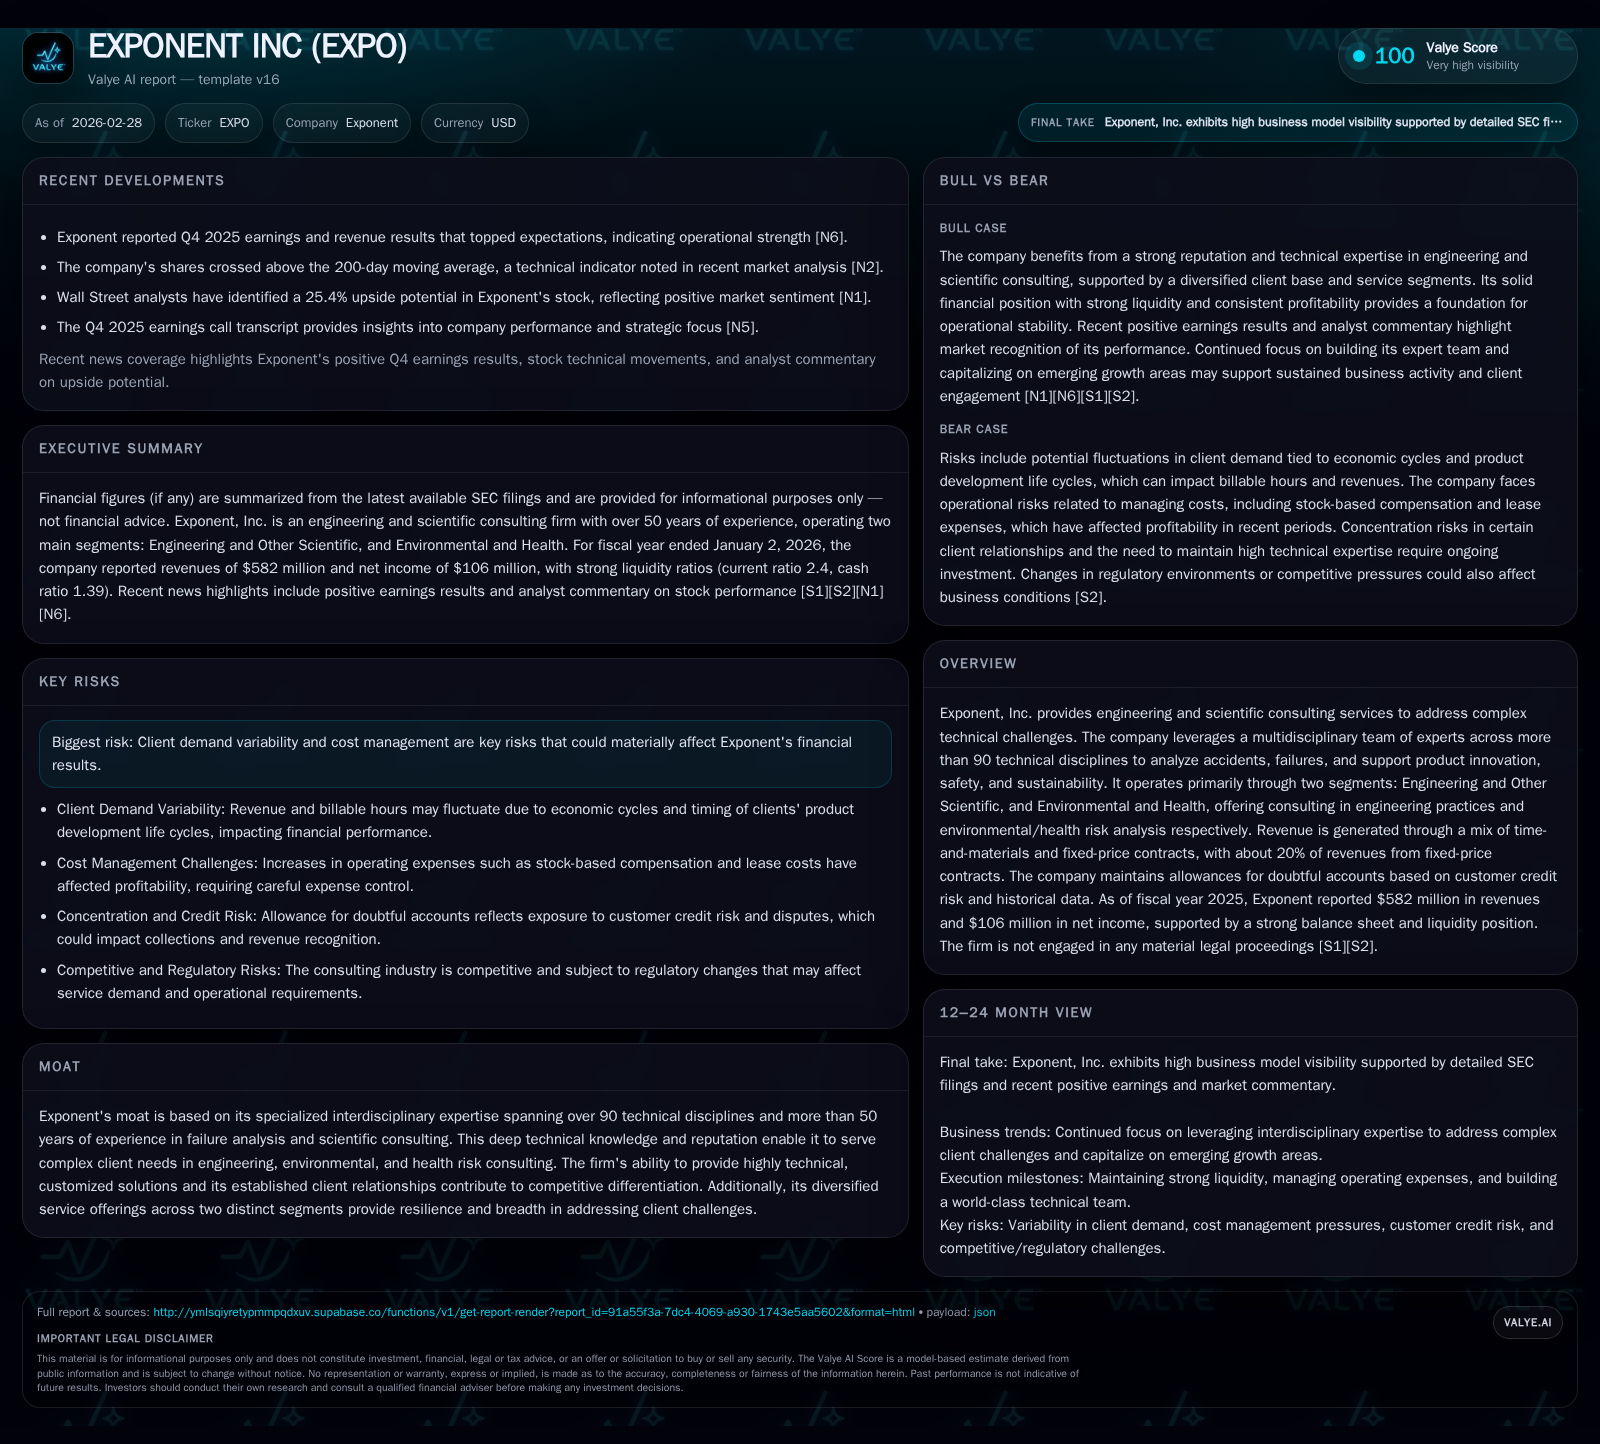
Exponent, Inc. reported a 4.2% revenue increase to $582 million in fiscal 2025, driven by its Engineering and Environmental segments. Net income edged down slightly due to cost pressures despite flat operating income near $120 million. The firm maintains a strong balance sheet with ample liquidity and returned significant capital via dividends and buybacks. Growth outlook hinges on sustaining demand across diverse industrial sectors amid competitive and economic challenges.
Historical Performance and Revenue Drivers
Exponent's fiscal year 2025 results reflect continued growth albeit at a measured pace compared with previous years. Total revenues reached $582 million, up 4.2% from $559 million in FY 2024 per the latest filed Form 10-K [F1]. This rise was largely supported by its core Engineering and Other Scientific segment alongside Environmental and Health services that tackle increasingly complex industrial problems.
Operating income remained essentially flat around $120 million (up just 0.2% YoY), signaling increasing operational costs or pricing pressures counterbalancing revenue gains [F1]. Correspondingly, net income showed slight contraction of 2.7% to $106 million [F1], possibly tied to elevated administrative expenses or higher compensation in its highly specialized workforce.
The firm’s moat is deeply tied to its multidisciplinary expertise across more than 90 technical disciplines accumulated over five decades, enabling tailored consulting solutions spanning accident investigations to risk assessments . The Engineering segment commands the majority share of revenues while the Environmental and Health segment adds resiliency via diversified demand from regulatory-driven consulting projects [S5][S6].
About one-fifth of revenues come from fixed-price contracts—a structure that can expose margins to changes in project scope or timeline overruns—while the remaining revenues are predominantly time-and-materials based which provide greater pricing flexibility [S26].
Segment Revenue Composition
Historical performance (annual)
| FY | Rev ($mm) | Net ($mm) | CFO ($mm) | OpInc ($mm) | Rev YoY | Net YoY |
|---|---|---|---|---|---|---|
| 2025 | 582 | 106 | 132 | 120 | +4.2% | -2.7% |
| 2024 | 559 | 109 | 145 | 120 | +4.1% | +8.6% |
| 2023 | 537 | 100 | 127 | 111 | +4.6% | -1.9% |
| 2022 | 513 | 102 | 94 | 141 |
Source: SEC companyfacts cache [F1].
Capital returns and efficiency (annual)
| FY | Div ($mm) | Buybacks ($mm) | FCF ($mm) |
|---|---|---|---|
| 2025 | 62 | 97 | 122 |
| 2024 | 58 | 6 | 138 |
| 2023 | 54 | 24 | 111 |
| 2022 | 49 | 156 | 82 |
Source: SEC companyfacts cache [F1].
*Exact segment splits for annual totals are not provided; quarterly filings show Engineering segment roughly six times larger than Environmental segment in recent periods [S5][S6][S16].
Future Growth Prospects
Looking ahead, Exponent’s growth will depend on its ability to secure new contracts amid variable demand across end markets such as chemicals, transportation infrastructure, consumer electronics product cycles, utilities, and environmental health initiatives. The company noted increased engagement related to failure analyses in chemicals and utilities sectors recently but moderated activity in consumer electronics owing to product life cycle timing shifts [S22].
Increasing regulatory scrutiny globally on environmental compliance may boost demand for Environmental and Health services yet competitive dynamics could cap pricing power. The relatively small but critical portion of fixed-price contracts requires careful project control to prevent margin erosion [S26].
Capital Allocation & Financial Returns
Exponent maintains robust capital discipline with strong cash flow generation supporting both organic investment and shareholder returns. Operating cash flow was $132 million in FY 2025 after a slight decline of nearly 9% compared to prior year likely due to working capital changes or higher expenses [F1]. Capital expenditures rose significantly by over one-third to $9.4 million, reflecting infrastructure maintenance at its test centers and expanded office/laboratory leases primarily across the U.S., Europe, and Asia-Pacific locations [F1][S4][S17].
Dividend payments grew incrementally to $61.5 million while share repurchases surged sharply to nearly $98 million from prior year’s lower level indicating board confidence in returning surplus capital efficiently [F1][S11][S27]. Equity at year-end stood at roughly $390 million after share buybacks impacted treasury stock accounts negatively year-on-year [F1][S9].
Return on equity approximated at a healthy 27%, calculated using trailing net income against average equity balances reflecting profitable reinvestment strategies alongside disciplined cost management despite margin headwinds [F1].
Risks & Operational Challenges
Client demand variability remains the most significant operational risk as Exponent serves cyclical industries susceptible to macroeconomic trends. Managing cost structures—especially personnel expenses given its credentialed workforce—and maintaining project profitability amidst contract mix shifts pose ongoing challenges. The allowance for doubtful accounts has been trending upward moderately reflecting cautious credit risk management given some clients’ financial constraints [S5][S23][S28].
Though Exponent reported no material legal proceedings or litigation risks currently [S8], evolving regulatory frameworks particularly around environmental consultancy standards may impose compliance costs or limit contractual flexibility.
Summary & What To Watch
Exponent Inc sustained steady growth in fiscal 2025 grounded on its technical consulting expertise spanning engineering failures to health-environmental risk analysis. Despite relatively flat operating income and slightly softer net earnings influenced by cost pressures, underlying fundamental strengths remain clear: niche technical barriers preventing easy competition combined with diversified service lines.
Going forward key indicators include demand patterns within high-exposure sectors such as chemicals/utilities versus cyclical consumer electronics; contract mix evolution between fixed-price vs time-based billing; capex trends linked to maintaining global lab/test infrastructure; and capital deployment efficiency balancing dividends against opportunistic buybacks.
Investors should monitor quarterly guidance updates alongside client sector profitability signals especially amid broader economic uncertainties that typically affect consulting budgets.
This analysis is intended solely for informational purposes regarding Exponent Inc based on publicly available financial data as of early 2026. It does not constitute investment advice or recommendations regarding securities or any other financial instruments.
Disclaimer: This is research-only, informational analysis and not investment advice. It may include AI-generated interpretation and general industry context. Always verify important details using primary sources.
Comments