
Fox Factory Advances Premium Performance Leadership Amid Inventory Build and Innovation Focus
Fox Factory reported modest liquidity shifts in Q2 2026 while emphasizing product innovation, OEM and aftermarket mix, and global expansion to support growth.
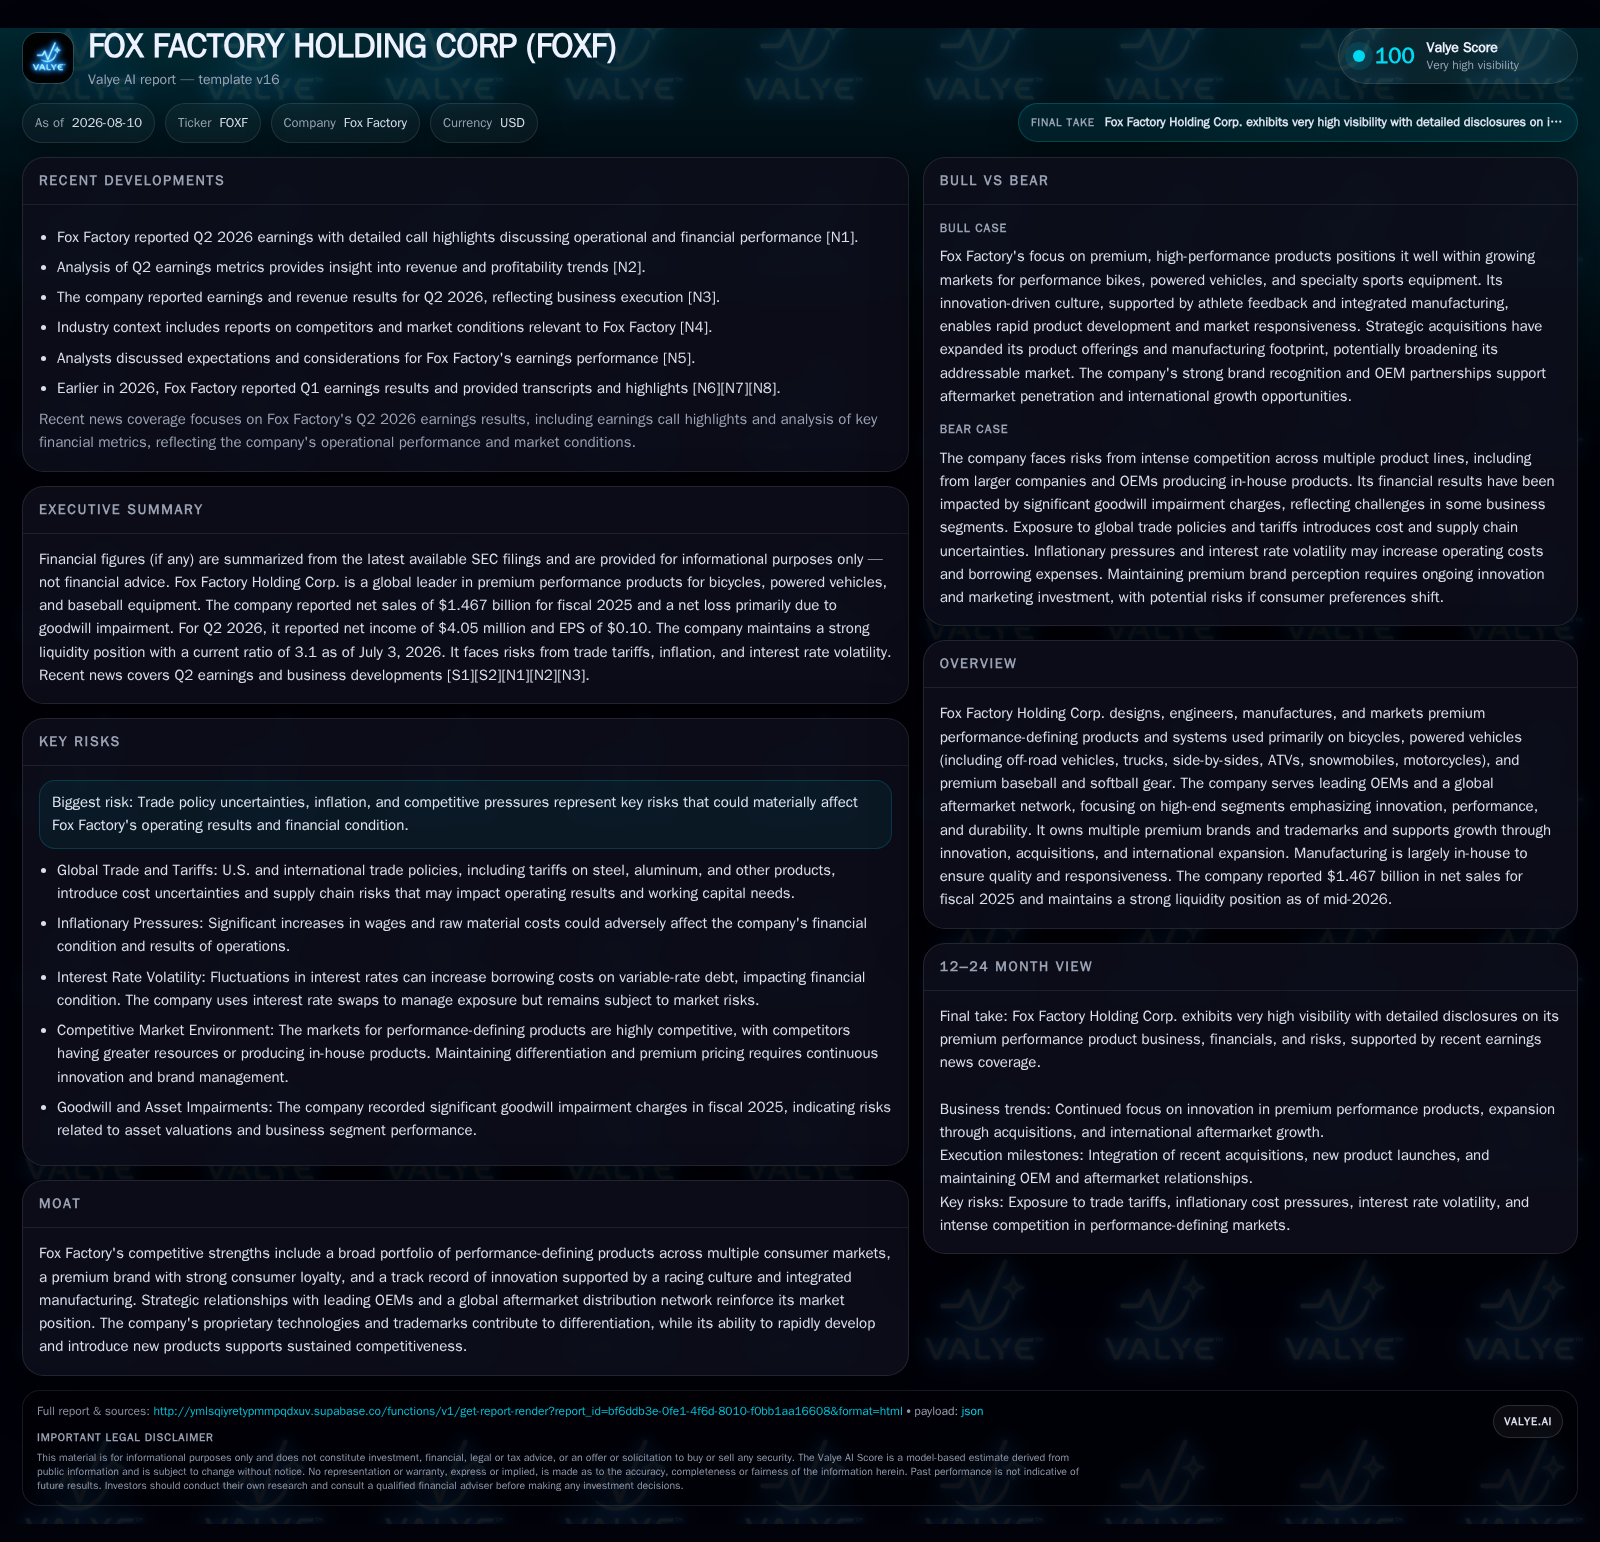
In its latest quarterly filing, Fox Factory Holding Corp. displayed a cautious near-term cash flow profile marked by increased inventory investments to meet expected demand. The company continues to leverage its vertically integrated manufacturing and broad portfolio across bicycles, powered vehicles, and premium sports gear to maintain leadership in performance-defining products. Despite macro uncertainties including inflation and trade policy risks, Fox Factory is strategically investing in innovation cycles, expanding OEM partnerships, and penetrating international markets. Its financial position remains solid with manageable leverage and a high current ratio supporting ongoing operational flexibility.
Recent Operating Update: Inventory Strategy Supports Demand Outlook
Fox Factory Holding Corp.'s Q2 2026 Form 10-Q details an intentional $17.4 million rise in inventory as the company builds stock ahead of expected consumer demand [S2]. This contrasts with prior periods where inventory levels were managed more tightly, reflecting management's confidence in sales momentum or a strategic buffer during supply chain complexities. At the same time, accounts receivable expanded by $13 million, consistent with an uptick in OEM or aftermarket shipments awaiting collection. The company notes improved payment timing but also hints at some payables acceleration reversal via a $5.9 million decrease. Such working capital swings manifest typical industry dynamics where product innovation cycles can induce episodic demand surges requiring agile inventory management [S2].
Business Model Analysis: Premium Performance Innovation with Diverse Channel Exposure
Fox Factory's business centers on designing, engineering, manufacturing, and marketing premium performance-defining products primarily for bicycles; off-road vehicles including side-by-sides (SxS), ATVs; on-road vehicles ranging from trucks to motorcycles; plus specialty diamond sports equipment for baseball and softball [S1][S25]. The company leverages strong brand equity built around technological advancement rooted in racing culture exposure—their products see usage in elite competitions such as the Olympics and Dakar Rally—a strategic asset enhancing consumer loyalty and pricing power.
Revenue arises through three principal channels: OEM partnerships constitute roughly 44% of net sales; the aftermarket constitutes approximately 49%; direct-to-consumer (DTC) sales represent near 7% but are strategically nurtured for future margin expansion [S20]. OEM clients include leading manufacturers across bicycles (e.g., Specialized), automotive dealerships (Ford, GM), and powersports segments; their scale delivers volume but requires negotiation and exposure to production cycle rhythms. Conversely, aftermarket clients—dealers and distributors numbering near 9,600 globally—offer broader diversification albeit more fragmented demand visibility.
Vertical integration is a notable element of Fox Factory’s value chain positioning [S1]. By managing much of its manufacturing internally rather than outsourcing extensively, the company maintains tighter quality control over performance-critical components such as suspension systems while enabling faster iteration on new product features to keep pace with frequent innovation cycles demanded by enthusiasts.[S25]
Industry Structure & Competitive Positioning: Innovation & Brand Loyalty as Moat Drivers
Operating within the specialty consumer durables industry places Fox Factory among peers such as Specialized Bicycle Components in high-end bicycle components, Tenneco Inc. in suspension systems, Polaris Inc. in off-road vehicles parts, and Callaway Golf in premium sports gear. This space is characterized by high product differentiation needs tied closely to technological advancement frequency and brand prestige.
Fox Factory’s moat derives from:
- A diversified portfolio spanning multiple sectors sensitive to performance enhancements.
- Strong consumer loyalty driven by professional athlete endorsements which serve as a powerful marketing multiplier.
- Proprietary technologies safeguarded by patents alongside registered trademarks including FOX®, providing defensible IP barriers [S20].
- Integrated manufacturing enabling rapid time-to-market on innovation launches critical when product lifecycles are compressed.
- Strategic global aftermarket distribution networks covering multiple geographies [S16], supporting both reach and revenue stability.
Margins hinge on ASP trends driven by continued product enhancement versus input cost pressure chiefly raw materials.[S12][S24] Competitive pressure mostly surfaces from lower-cost suppliers who compete primarily on price rather than technology or brand cachet.
Growth Drivers: Innovation Cadence & Geographic Expansion
Several structural tailwinds support Fox Factory's growth trajectory:
- Increasing consumer appetite for technologically advanced performance products fuels upgrading cycles across bikes and powersports segments domestically and internationally [S1].
- Rising ASPs on differentiated products enhance both top-line and margin potential—innovation delivered through new suspension technologies or advanced materials command premium price points.
- Expanding global distribution taps emerging outdoor recreation enthusiasm especially outside established Western markets.
- OEM partnerships deepen as vehicle makers continue differentiating models via supplier innovations.
- Acquisition strategy including adding Custom Wheel House’s high-performance wheels expands product breadth enhancing cross-selling opportunities [S1].
- Growing DTC channels enable improving gross margin capture though require effective marketing investment.
Associated KPIs for tracking growth include net sales growth rates by channel segment (OEM vs aftermarket vs DTC), average selling price trajectory relative to cost inflation trends, frequency of product innovation rollouts evidenced through pipeline disclosures or patent filings, inventory turnover ratios signaling efficient supply chain response to changing demand cycles, and geographic revenue breakdowns revealing success penetrating new markets [S20][N1]
Risks and Growth Constraints: Inflationary Pressures & Trade Policy Exposure
Key risks acknowledged include:
- Raw material cost volatility impacting gross margins given the specialized metals and composites integral to product fabrication [S24].
- Trade policy uncertainty remains salient post-Trump administration tariffs despite U.S. Supreme Court rulings enabling tariff refunds; administrative hurdles make future cost relief timing unclear [S4].
- Prolonged inflation elevating wage costs could pressure operating expenses if productivity gains lag.
- Dependency on OEM contracts imposes risk linked to production schedules; OEM demand softness could depress revenues temporarily.
- Supply chain disruptions remain a systemic threat given global sourcing complexity affecting lead times crucial for new product launches.
- Currency fluctuations introduce earnings variability due to international operations exposure [S12].
Legal proceedings related to securities allegations concluded without material financial impact as of early 2026 reducing potential overhang risk [S12][S15]
Inventory obsolescence due to fast-moving product innovation cycles also demands vigilant active inventory management balancing availability versus markdown risk [S2].
What to Watch Next: Demand Signals & Execution Milestones
Going forward blindness will be mitigated by monitoring:
- Quarterly OEM order volumes relative to backlog trends reflecting underlying industrial demand health.
- Aftermarket sales volumes reflecting end-user enthusiasm especially under outdoor recreation participation shifts post-COVID.
- Average selling price dynamics across categories signaling if premium positioning withstands competitive entry or inflation pass-through capacity.
- Inventory turnover rates to judge fulfillment efficiency amidst faster innovation cycles.
- Gross margin percentage evolution indicating cost control success versus pricing power sustainability.
- Capital expenditures levels revealing investment in capacity or automation aligned with growth plans.
- Progress on strategic acquisitions integration measuring accretion impacts incrementally on EBITDA margins.
Earnings call commentary around consumer buying pattern shifts post-inflationary shocks will also provide directional insight into discretionary spending trends influencing growth durability [N1].
Financial Profile Discussion
As of July 3, 2026 balance sheet data shows Fox Factory holds approximately $58 million in cash against total debt nearing $512 million yielding net debt around $454 million [F1]. The company's current assets substantially exceed current liabilities ($764 million vs $246 million), producing a strong current ratio of roughly 3.1 evidencing robust short-term liquidity buffers supporting operational needs [F1].
Interest expense variability driven by floating rate debt tied to SOFR plus margin adjustments following credit agreement amendments signals sensitivity to external rate hikes though mitigated partially via interest rate swaps described previously [S10][S14]. Free cash flow generation at $13 million over six months suggests conservative working capital positioning currently exercised through planned inventory build reflecting confidence in upcoming demand phases rather than distress liquidity constraints.[S2]
Near-term capital allocation continues balancing acquisition funding deployed notably to Marucci-related deals against debt amortization obligations including quarterly principal repayments per credit facility terms expiring October 2030 [S7][S13][S21]
Disclaimer: This analysis is provided solely for informational purposes reflecting publicly available filings and news regarding Fox Factory Holding Corp. It does not constitute investment advice or research views.
Disclaimer: This is research-only, informational analysis and not investment advice. It may include AI-generated interpretation and general industry context. Always verify important details using primary sources.

Comments