
Greystone Logistics: Growth Patterns and Capital Discipline in Plastic Pallets Manufacturing
An examination of how Greystone’s proprietary plastic pallet designs and sustainable positioning influence its financial trajectory amid customer concentration and liquidity challenges.
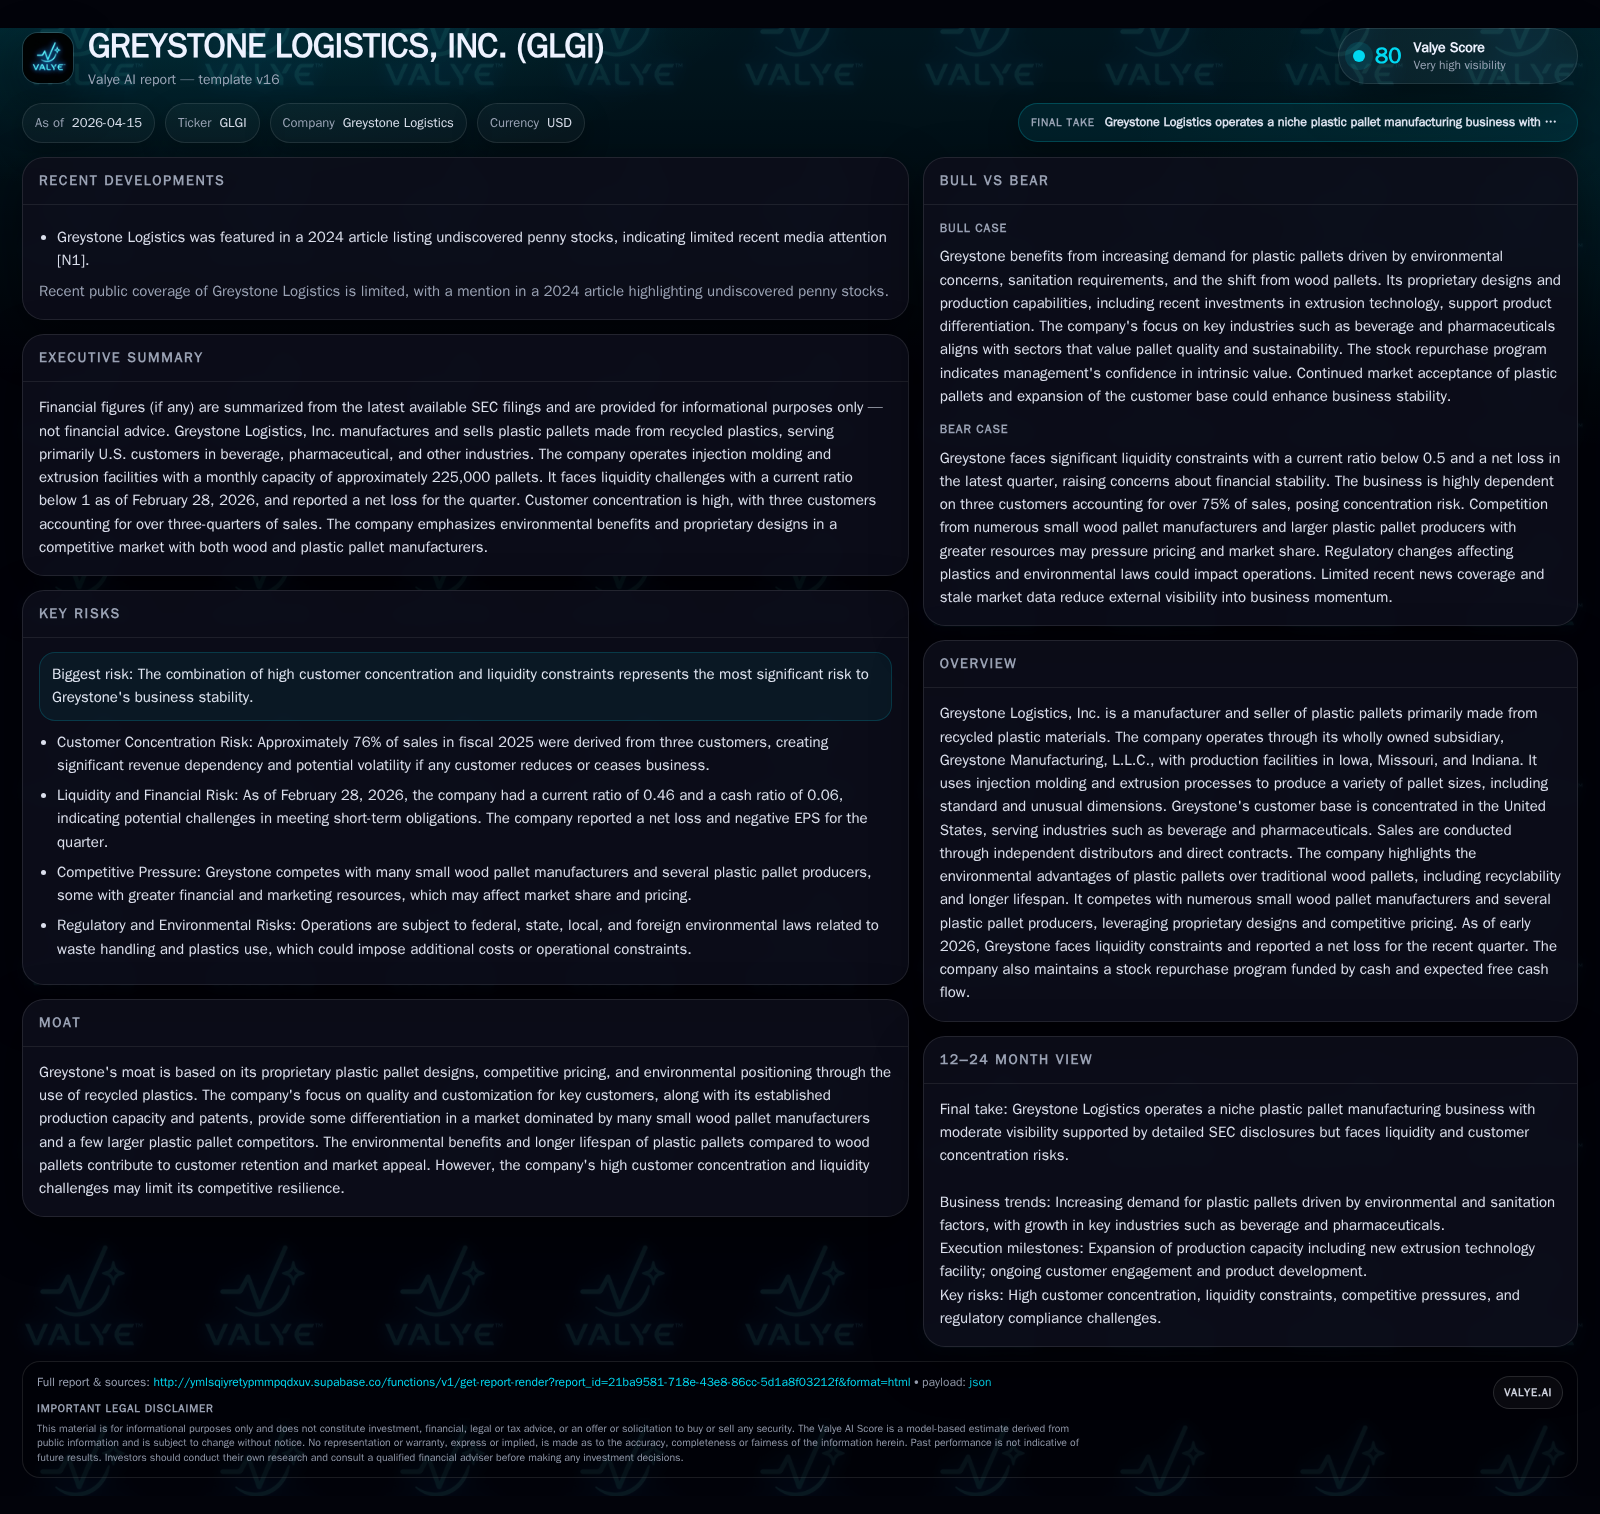
Greystone Logistics, Inc. specializes in manufacturing plastic pallets from recycled materials with a proprietary design focus, catering predominantly to U.S.-based beverage and pharmaceutical industries. Despite growing production capacity and positive operating cash flows, the company experienced significant declines in operating and net income recently, largely driven by concentrated customer demand and operational costs. Capital allocation reflects cautious discipline with rising capex geared toward extrusion technologies balanced against modest share repurchases and shrinking dividends. Environmental advantages underpin market differentiation but financial volatility highlights a fragile moat reliant on key customers and operational resilience.
Historical Performance Analysis: Revenue, Profitability, and Production Capacity
Greystone Logistics operates primarily through its wholly owned subsidiary Greystone Manufacturing, L.L.C., with manufacturing sites in Bettendorf, Iowa; Palmyra, Missouri; and since April 2023, Jasper, Indiana. The company utilizes injection molding from 14 machines (12 in Iowa, 2 in Missouri) to supply roughly 225,000 pallets per month [S1]. This production capability supports a product mix that includes standard rackable sizes such as the GMA pallet (48" x 40") as well as customized dimensions like 30"x30" or 96"x48", leveraging proprietary manufacturing techniques including robotically welded extrusion pallets at the Jasper facility [S21].
On the financial side, the latest available top-line figure dates from FY2019 at $3.4 million [F1]. While no updated total revenue figures were disclosed subsequently, operating income shows growth from $2.57 million in FY2022 to $4.31 million in FY2025 [F1]. The increasing profitability contrasts with earlier years when the company posted lower margins.
Shifts in Operating Income and Net Earnings: Parsing Year-Over-Year Changes
Despite expanded operational capacity, Greystone reported a notable contraction in profitability in its most recent fiscal year (FY2025). Operating income declined by approximately 39.6%, falling from $7.14 million in FY2024 to $4.31 million [F1]. This sharp drop corresponded with an even steeper decrease of 63.2% in net income over the same period—$2.35 million versus $6.39 million in FY2023 [F1]. Such volatility indicates that earnings are sensitive to variations in cost structure or pricing dynamics even amidst relatively fixed production assets.
That said, operating cash flow remained positive at $10.29 million for FY2025 but fell by about 17% year-over-year from $12.39 million prior [F1]. The disparity between cash generation and net earnings suggests non-cash expenses or working capital changes impacting reported profits.
Greystone’s Customer Base: Risks from Concentrated Demand and Industry Focus
Customer concentration presents a material risk for Greystone’s business stability. In fiscal years 2024 and 2025, the top three customers accounted for approximately 81% and then about 76% of total revenue respectively [S4][S18]. Predominantly serving beverage and pharmaceutical sectors within the United States, this concentrated reliance exposes Greystone to demand shocks should these clients reduce orders or switch suppliers.
These customers often employ closed loop distribution systems where customized pallet solutions are required—and Greystone holds exclusive approval for their specific pallet configurations [S4][S18]. However, the dependency limits diversification and heightens vulnerability amid evolving industry conditions or regulatory shifts.
Market Positioning Through Innovation and Sustainability Advantages
Greystone’s competitive advantage is anchored by proprietary injection-molded pallet designs protected through national and international patents [S17], which offer durability superior to traditional wood pallets commonly used across supply chains [S19]. The switch from wood—comprising roughly 80-90% of palettes in U.S. commerce—to recyclable plastic addresses environmental concerns such as deforestation impact on carbon emissions [S20].
The use of approximately 60 million pounds of post-consumer recycled plastic annually furthers these ESG credentials by reducing landfill plastic waste [S17]. Additionally, plastic pallets’ longer lifespan lowers cost per trip significantly compared to wood alternatives—an aspect emphasized when competing with numerous fragmented small-scale wood pallet manufacturers.
Notably, Greystone leverages its expanded extrusion capacity featuring robotic welding technology enabling custom-sized pallets beyond standard dimensions. This capability facilitates integration into automated material handling systems that increasingly demand uniformity and reliability from pallets—particularly appreciated in high-throughput beverage or pharmaceutical logistics [S21].
Capital Allocation Review: Share Repurchases, Dividends, Capex Trends, and Liquidity Considerations
Capital discipline remains a defining theme for Greystone amid fluctuating earnings performance. Capital expenditures surged sharply by approximately 105% year-over-year from $2.8 million in FY2024 to $5.75 million in FY2025 [F1]. This spike relates primarily to equipment investments for extrusion-based manufacturing processes launched at the Jasper facility emphasizing automation and production flexibility [S21].
Share repurchase activity occurs under Rule b5-1 plans allowing for methodical buybacks depending on market conditions; during mid-2025 partial share purchases were recorded with remaining authorization permitting further repurchases [S5][S6]. Despite free cash flow (operating cash flow less capex) remaining positive at around $4.53 million for FY2025 [F1], dividend payments decreased notably—from $721K in FY2024 down to roughly $427K—reflecting cautious balancing between rewarding shareholders and preserving liquidity.
Liquidity metrics reveal tight short-term coverage with a current ratio standing at just approximately 0.46 as of February 2026 [F1][S14], indicating liabilities exceed current assets by more than double—potentially constraining agility if operational headwinds intensify.
Forward-Looking Considerations: Industry Demand Signals and Strategic Constraints
While no explicit official guidance has been disclosed recently for future fiscal periods [S22], industry analysts project robust growth globally in plastic pallet markets driven by trade expansion especially across Middle East/Africa corridors along with intensified ESG compliance pushed by governments worldwide [S22]. Persistence Market Research forecasts global plastic pallets demand expanding at double-digit CAGR (>10%) into the late 2020s fueled by hygiene standards favoring plastics over porous wood pallets as well as adoption by new sectors seeking efficiency improvements via closed-loop supply chain architectures.
Moreover, Greystone’s backlog remains tied intricately to its major customers’ order patterns making diversification efforts critical but challenging given entrenched long-term contracts focused on highly-customized products [S4][S18]. Raw material input costs remain manageable currently due to local sourcing but any shifts could pressure margins given competitive pricing strategies deployed against both wood manufacturers and larger plastic producers [S18][S17].
Key Metrics Table: Historical Financial Trends at a Glance
Historical performance (annual)
| FY | Net ($mm) | CFO ($mm) | OpInc ($mm) | Capex ($mm) | Net YoY |
|---|---|---|---|---|---|
| 2025 | 2 | 10 | 4 | 6 | |
| 2024 | 12 | 7 | 3 | ||
| 2023 | 6 | 4 | 4 | 9 | +40.5% |
| 2022 | 5 | 7 | 3 | 6 | +25.4% |
Source: SEC companyfacts cache [F1].
Capital returns and efficiency (annual)
| FY | Div ($) | FCF ($mm) | ROE% |
|---|---|---|---|
| 2025 | 427103 | 5 | 11.8 |
| 2024 | 721640 | 10 | |
| 2023 | 446644 | -5 | 32.7 |
| 2022 | 243082 | 1 | 33.2 |
Source: SEC companyfacts cache [F1].
*Note: Data gaps due to absence of matching year-end figures.
Conclusions on Competitive Moat Strength Amid Financial Volatility
Greystone Logistics maintains differentiation rooted in patented proprietary designs tailored to specialized pallet sizes demanded by major beverage and pharmaceutical clients within the U.S., coupled with an environmentally aligned value proposition leveraging recycled plastics—a strategic moat not easily replicable by traditional wood manufacturers dominating large swathes of the market.
However, financial results reveal fragility underlying this moat due principally to elevated customer concentration (~76% revenue dependence on three clients), liquidity tightness (current ratio ≈0.46), and profit margin compression evident from volatile operating income swings (-39.6%) paired with declining net earnings (-63.2%) despite healthy operating cash flow.
Capital deployment into advanced extrusion manufacturing technologies reflects intent to innovate beyond injection-molding limits while cautiously funding share repurchases amid dividend pullbacks signals prudent capital stewardship against uncertain market receptions.
Looking ahead without firm forward guidance available yet ongoing sector trends suggest growth opportunities exist particularly if Greystone expands its customer base beyond core concentrated segments while maintaining cost competitiveness alongside its environmental credentials—even so it must navigate operational contingencies carefully lest recurrent margin instability threaten its relatively narrow economic moat.
Disclaimer: This analysis is based solely on publicly available SEC filings up through Q3/2026 periods without inclusion of any material non-public information or speculative projections beyond cited evidence herein.
Disclaimer: This is research-only, informational analysis and not investment advice. It may include AI-generated interpretation and general industry context. Always verify important details using primary sources.
Comments