
Starco Brands Faces Crossroads: Surging Revenues Shadowed by Heavy Losses and Debt
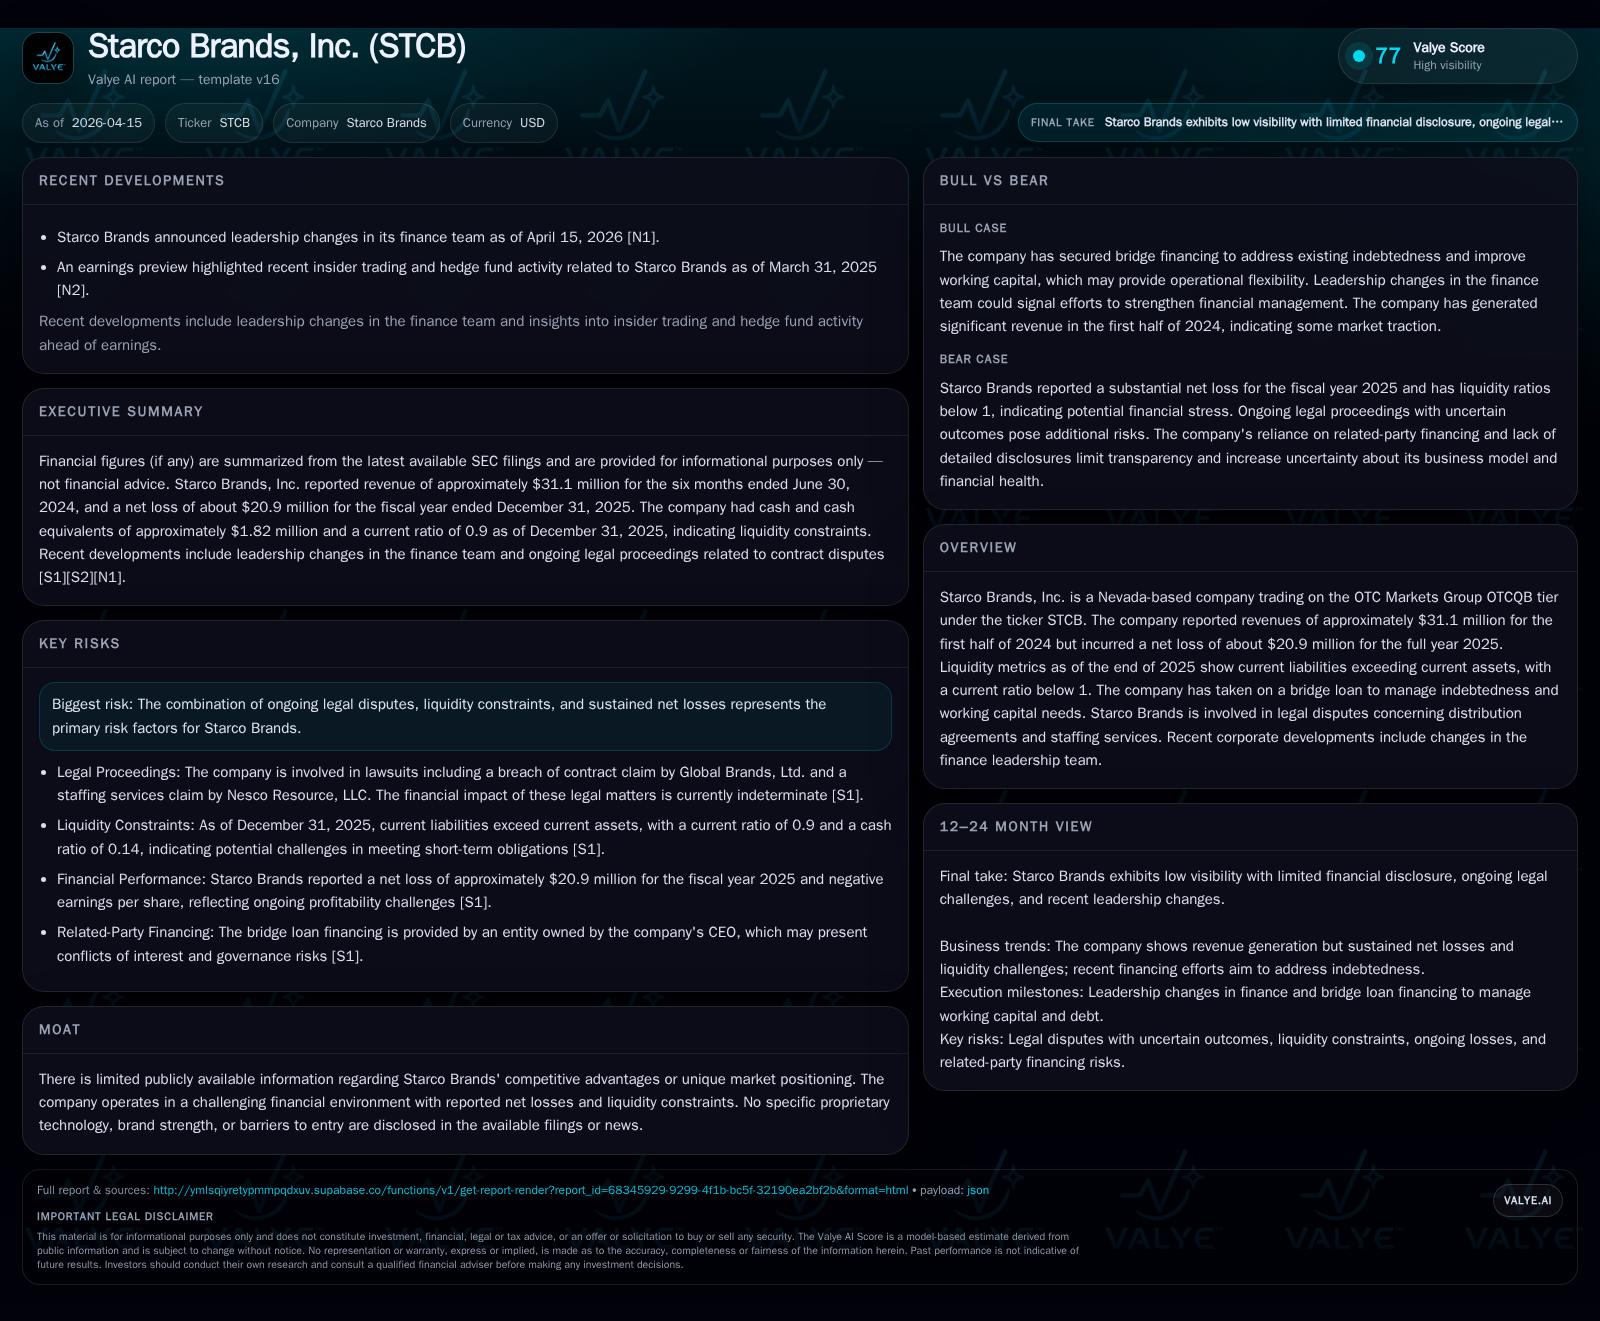
Starco Brands exhibits extraordinary revenue growth yet wrestles with deepening net losses, liquidity strains, and legal disputes.
Since 2019, Starco Brands has demonstrated explosive top-line expansion, propelled by expansive distribution efforts and contract acquisitions. However, this rapid revenue surge coexists with amplifying operating and net losses, reflecting operational inefficiencies and unfavorable cost structures. The company’s liquidity is under significant pressure, necessitating reliance on a $4.5 million bridge loan with stringent terms from a related-party lender. Concurrently, legal disputes over contractual obligations in the UK and staffing services add strategic uncertainty. Recent finance leadership changes signal attempts to strengthen financial oversight amid these challenges.
Revenues Accelerate but Profitability Worsens: A Historical Financial Snapshot
Starco Brands’ financial evolution over recent years paints a picture of dramatic revenue expansion coupled with mounting profitability challenges. Starting from revenues of just $240 thousand in FY2019 [F1], the company leveraged aggressive growth strategies resulting in a surge to over $65.2 million by FY2023—an astronomical year-over-year increase of roughly 734.7% from FY2022 to FY2023 alone.
However, this top-line momentum starkly contrasts with the trajectory of operating results. Operating income shifted from a positive $1.15 million in FY2022 to deeply negative $45.45 million in FY2023, followed by persistent losses of approximately $14.4 million in FY2024 and further declining to -$18.78 million by FY2025 [F1]. Correspondingly, net income mirrored this erosion moving from a modest profit of about $810 thousand in FY2022 to net losses exceeding $46 million in FY2023 and settling near -$20.9 million for FY2025.
Operating cash flows offer additional nuance: while positive but modest in early years ($377 thousand in FY2022 and $687 thousand in FY2023), CFO dropped sharply to -$900 thousand for FY2025 [F1], an unhealthy development given the company’s rising capex commitments (though relatively low at ~$113 thousand in FY2025). This shift signals growing cash burn alongside deficient earnings power.
Equity levels reflect extended operational losses, with shareholder equity contracting markedly from over $32.7 million at end-2022 down to just above $5.1 million at end-2025 [F1], driving an approximate negative return on equity near -409%, indicating substantial erosion of invested capital amid weak profitability.
Historical performance (annual)
| FY | Rev ($mm) | Net ($mm) | CFO ($mm) | OpInc ($mm) | Rev YoY | Net YoY |
|---|---|---|---|---|---|---|
| 2025 | -21 | -1 | -19 | -18.6% | ||
| 2024 | -18 | 2 | -14 | +61.8% | ||
| 2023 | 65 | -46 | 1 | -45 | +734.7% | -5802.9% |
| 2022 | 8 | 1 | 0 | 1 |
Source: SEC companyfacts cache [F1].
Capital returns and efficiency (annual)
| FY | Buybacks ($) | FCF ($) | ROE% |
|---|---|---|---|
| 2025 | -1013720 | -408.9 | |
| 2024 | 131400 | 1904856 | -95.9 |
| 2023 | 131400 | 650221 | -269.1 |
| 2022 | 131400 | 2.5 |
Source: SEC companyfacts cache [F1].
Note: Latest annual revenue after FY2023 is not explicitly provided; trends based on available data points [F1].
This juxtaposition between soaring sales volumes and escalating operational losses underscores structural or strategic inefficiencies that may be rooted in cost control challenges or unprofitable scaling.
Dissecting 2025: Drivers Behind Revenue Growth and Operating Loss Expansion
While explicit revenue figures for full-year 2024 and 2025 are undisclosed post-FY2023 [F1], disclosed segment details indicate geographic expansion with focused distribution efforts—particularly involving Whipshots brand products internationally [S5]. The company’s initiatives included acquisitions aimed at vertically integrating its consumer product platform [S18], suggesting increased complexity but also potentially higher overhead costs.
Losses expanded steadily through these periods; operating expenses outpaced any incremental top-line lift causing deteriorating margins [S1]. Notably, structural costs such as marketing reductions via elimination of the Chief Marketing Officer role imply ongoing attempts at reorganization [S20]. Yet the persistent operating loss widening suggests that fixed-cost leverage benefits have yet to materialize.
Moreover, changes within the finance leadership team announced April 15th, 2026 [N1], hint at management recognizing urgent needs for stronger financial controls and efficiency improvements amidst these losses.
Legal Battles Complicate Strategic Outlook: Distribution and Staffing Disputes
Starco Brands faces material litigation risks primarily centered on two disputes:
Global Brands Ltd v. Starco Brands: Filed in the US District Court Central District of California under Case No. 2:25-cv-12147-HDV-BFM; this involves alleged breach of contract pertaining to the UK distribution agreement for Whipshots products [S8]. Starco has answered with counterclaims but remains unable to quantify potential damages or recovery ranges.
Nesco Resource LLC v. The Starco Group Inc: Pending before Ohio State Court Case No. CV26131502 alleging unpaid staffing services amounting to approximately $150K [S8]. Negotiations are ongoing without clear resolution timelines.
These disputes introduce both direct financial liability uncertainties and strategic distractions that could hamper operational focus or complicate international expansion efforts [S1][S8].
Liquidity Landscape: Decoding Bridge Loans, Capital Structure, and Working Capital Tensions
By the close of fiscal year 2025 Starco’s liquidity position exhibited stress:
- Current liabilities totaled approximately $13.3 million versus current assets of about $11.9 million yielding a current ratio around 0.9—below conventional comfort thresholds [F1].
In response to working capital demands and prior indebtedness restructuring needs, the company executed a Bridge Term Loan Promissory Note with The Starco Group Inc., wholly owned by CEO Ross Sklar [S9][S10][S15].
The initial disbursement was $4.5M out of a possible $5M facility aimed at retiring prior obligations including Gibraltar Business Capital loans [S10]. Key loan terms include:
- Interest rate: Lesser of the highest lawful rate or prime plus an applicable margin of ~4.25%, minimum prime floor at 6%
- Monthly interest payments commenced January 1st, 2026; principal repayments begin January 1st, 2027 escalating over four years from $28K/month up to $66K/month by December 2030
- One-time deferment option for up to six months on principal payment available subject to lender discretion but triggers higher interest rate (+0.50%) during deferral periods
- Standard default clauses permitting acceleration upon missed payments or covenant breaches including insolvency events [S9][S15]
Cash & equivalents stood at about $1.8M at year-end against significant contingent liabilities potentially weighing on short-term financial flexibility [F1]. Dependence on related party lending adds complexity given inherent conflicts yet provides vital funding lifelines absent more traditional credit access.
Capital Allocation Insights: Absence of Dividends and History of Share Repurchases
Capital returns have skewed towards cautious buybacks rather than dividends owing primarily to ongoing losses:
- Annual share repurchase transactions have remained consistently modest around $131K through fiscal years since at least FY2022 despite sustained negative earnings [F1][S11][S12][S13][S14][S20].
- No dividends have been declared or paid historically due to constrained profitability.
This measured approach indicates limited excess capital but reflects an intent by management to stabilize share count possibly supporting stock price dynamics or ownership concentration amid restructuring pressures.
Leadership Shifts in Finance and What They Signal for Corporate Strategy
Announced April 15th, 2026 leadership changes incorporated new appointments within the finance team aimed at bolstering financial management effectiveness after a period marked by escalating losses and liquidity complications [N1]. The adjustment potentially signals renewed emphasis on tighter cost controls, improved forecasting accuracy, and enhanced capital stewardship—all critical given recent fiscal adversity.
Forward View: Key Milestones to Monitor Amid Constraints and Potential Opportunities
There is no explicit public guidance on future projections or forecasts within recent disclosures; however key milestones warranting close attention include:
- Initiation date of principal payments under the bridge loan schedule starting January 2027, influencing free cash flow burdens considerably given incremental monthly outflows required [S9][S15].
- Resolution progress regarding the Global Brands Ltd litigation concerning UK distribution agreements, and amicable conclusion or settlement developments related to Nesco resource staffing claims impact contingent liability profiles [S8][S1].
- Quarterly earnings reporting updates expected through OTCQB filings, specifically scrutinizing revenue sustainability beyond explosive growth phases, and any improvements in operating cash flows indicative of underlying business stability.
Given the opaque strategic positioning coupled with intensifying financial demands, cultivating visibility into the outcome of legal disputes alongside liquidity restoration pathways is essential for comprehending longer-term viability prospects.
Disclaimer: This analysis compiles available public disclosures without extrapolating undisclosed metrics or issuing investment advice.
Disclaimer: This is research-only, informational analysis and not investment advice. It may include AI-generated interpretation and general industry context. Always verify important details using primary sources.
Comments