
Gladstone Commercial Corp Strengthens Portfolio with Net Lease Resilience and Steady Cash Flow
Long-term net leases underpin Gladstone Commercial’s robust portfolio while capital maneuvers support growth and shareholder distributions.
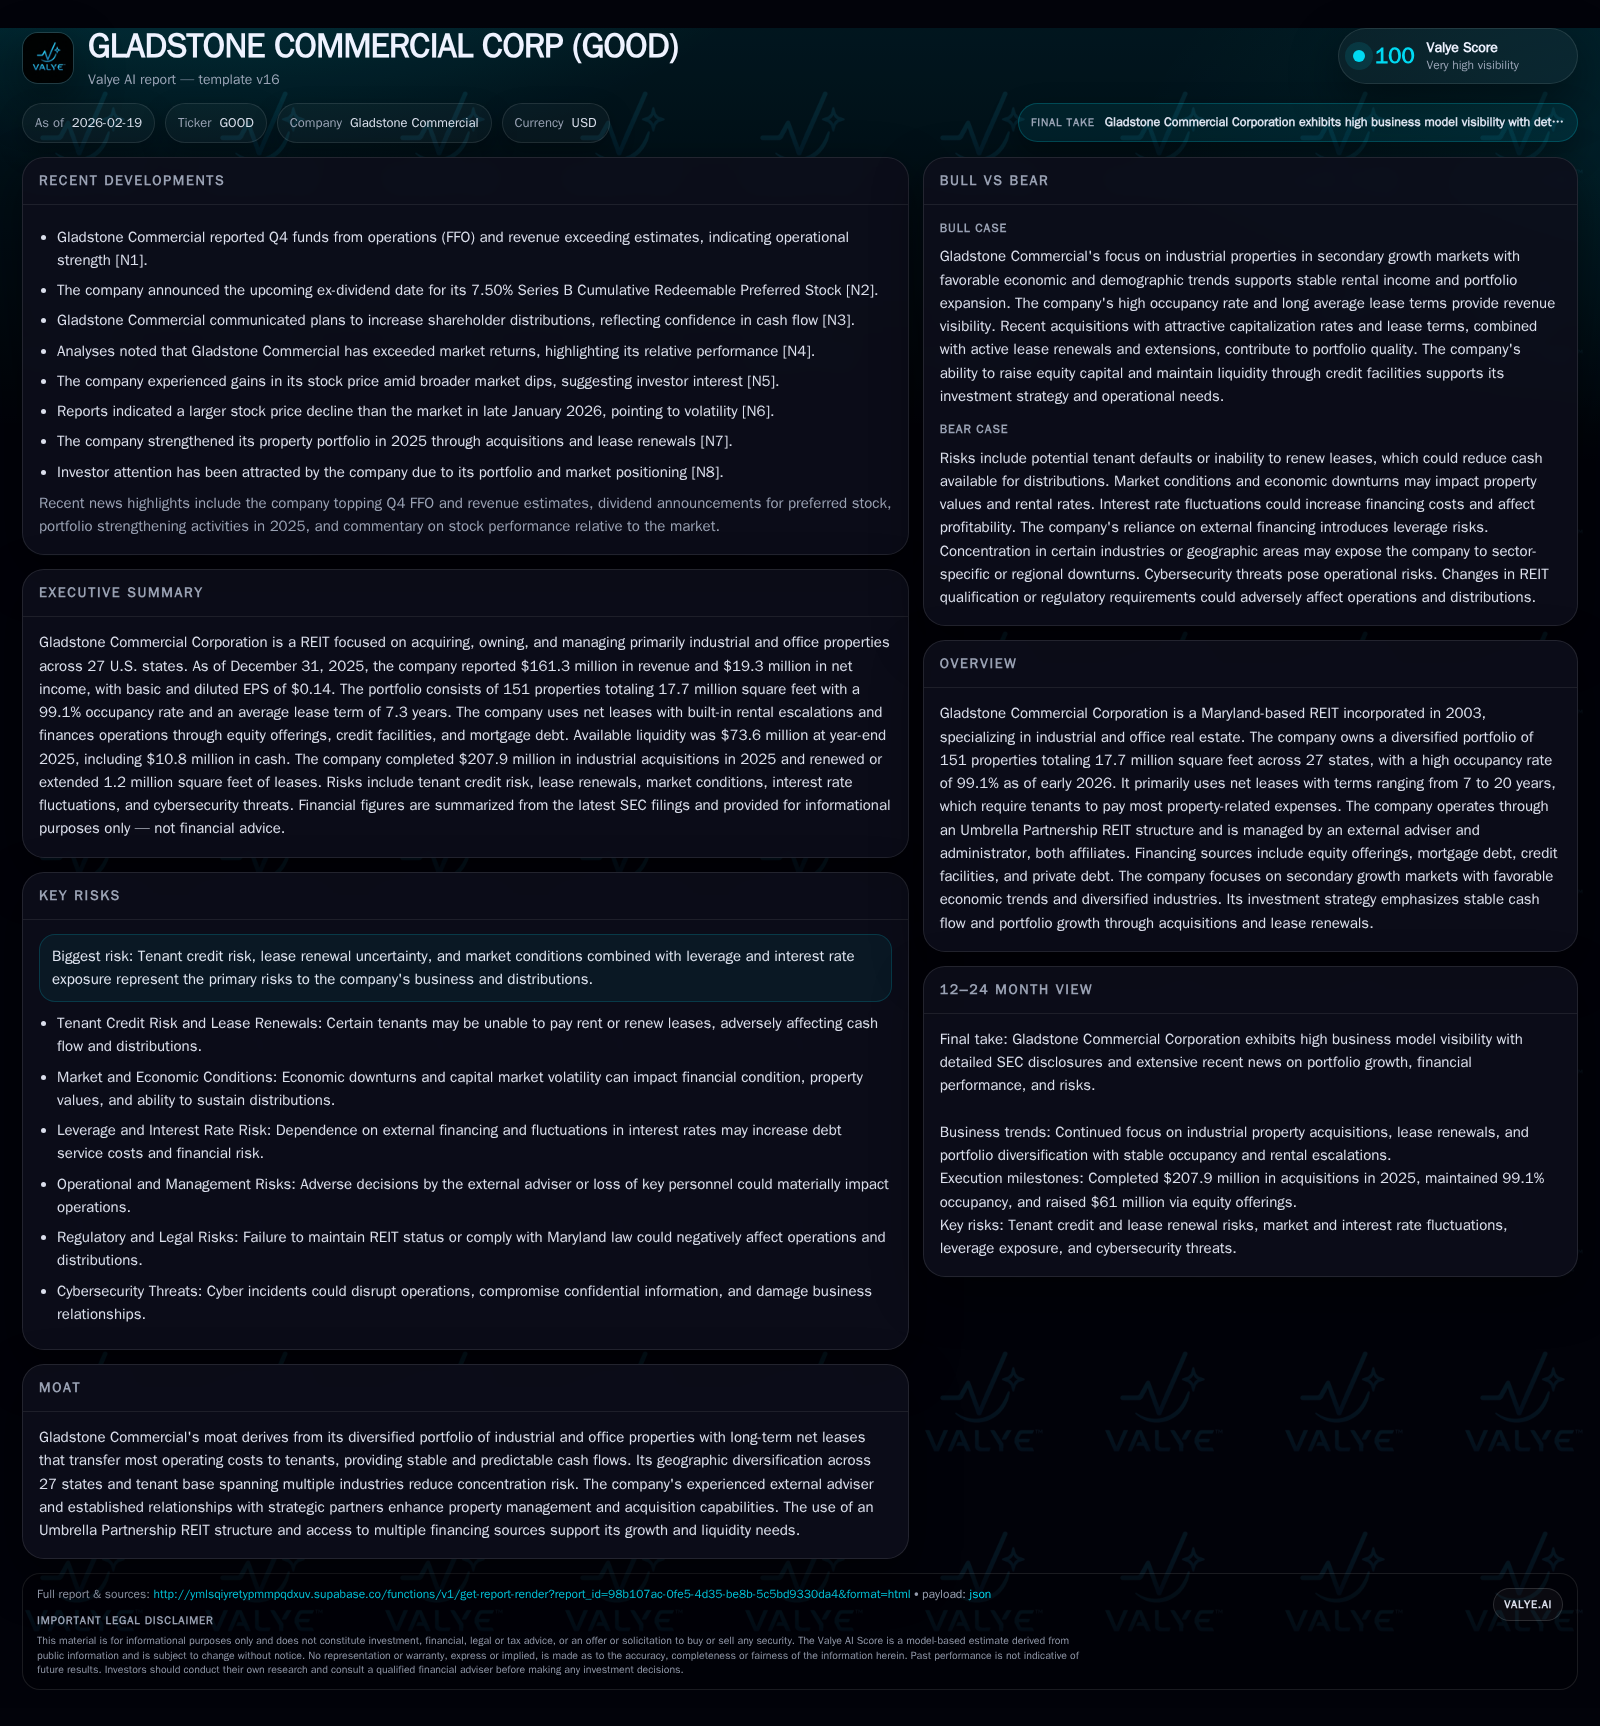
Gladstone Commercial Corporation reported solid revenue growth in 2025, reaching $161.3 million with an 8% increase year-over-year, driven by strategic acquisitions and high occupancy of 99.1%. Despite a near 20% decline in net income, operating cash flow saw a substantial 54.8% surge, supporting consistent dividend payments of over $68 million. The company’s emphasis on long-term net leases across a geographically diversified portfolio reduces operating cost exposure and underpins stable cash flow generation. Recent upsizing of credit facilities and debt refinancings reflect prudent capital management aimed at liquidity and portfolio expansion amidst market uncertainties such as tenant credit risk and interest rate volatility.
Stable Leasing Model and Portfolio Composition: Foundation for Growth
Gladstone Commercial Corporation operates a portfolio dominated by long-term net leases spanning durations from seven to twenty years, an essential characteristic providing resilience amid volatile property markets [S1]. Tenants bear most operating expenses including maintenance, insurance, and property taxes under these leases, enforcing tenant indemnity clauses that mitigate landlord exposure to fluctuating costs [N8]. This leasing approach affords Gladstone stable and predictable cash flows, enabling disciplined financial planning.
The company’s portfolio consists of 151 industrial and office properties totaling approximately 17.7 million square feet distributed across 27 U.S. states [N8][S1]. Such geographic diversification serves to reduce sectoral or regional concentration risk—a valuable hedge given economic cycles can diverge across markets. Gladstone targets secondary growth markets with favorable economic trends and diverse industries rather than oversaturated primary metros [N8]. This selection criteria supports tenancy stability and potential rental growth.
Financial Trajectory: Analysis of 2025 Historical Performance and Key Drivers
In fiscal year 2025, Gladstone Commercial achieved revenues of $161.3 million, reflecting an approximately 8% increase compared to $149.4 million reported in FY2024 [F1]. This uptick was largely fueled by acquisitions completed during the year, coupled with sustained high occupancy averaging around 99.1%, demonstrating successful leasing activity [S1][N1].
However, net income declined from roughly $24.0 million in FY2024 to $19.3 million in FY2025—a drop close to 19.6% year-over-year [F1]. This contraction likely stems from increased interest expense associated with larger borrowings under amended credit facilities as well as depreciation charges linked to recent acquisitions [S14]. Despite this income dip, operating cash flow grew markedly by nearly 54.8%, surging from about $56.9 million in FY2024 to $88.2 million in FY2025 [F1], underscoring improved core liquidity supporting dividend coverage.
Historical performance (annual)
| FY | Rev ($mm) | Net ($mm) | CFO ($mm) | Rev YoY | Net YoY |
|---|---|---|---|---|---|
| 2025 | 161 | 19 | 88 | +8.0% | -19.6% |
| 2024 | 149 | 24 | 57 | +1.2% | +381.4% |
| 2023 | 148 | 5 | 60 | -0.9% | -46.4% |
| 2022 | 149 | 9 | 69 |
Note: Omitted columns lack sufficient annual XBRL coverage in the provided tags (need ≥2 annual points): OpInc, Capex, FCF. Source: SEC companyfacts cache [F1].
Capital returns and efficiency (annual)
| FY | Div ($mm) | Buybacks ($) | ROE% |
|---|---|---|---|
| 2025 | 68 | 0 | 11.2 |
| 2024 | 63 | 0 | 14.0 |
| 2023 | 61 | 998000 | 3.3 |
| 2022 | 71 | 4.6 |
Source: SEC companyfacts cache [F1].
Note: Operating income not available in provided tags; Buybacks paused since FY2024.
Acquisitions and Market Focus: Expanding in Secondary Growth Markets
A key component driving Gladstone’s revenue growth in 2025 was acquisition activity, notably the purchase of a nine-property portfolio finalized on September 30, 2025 [N8][N4]. These transactions align with the company’s strategy targeting industrial properties located within secondary markets showing robust economic fundamentals but less competition than major metros.
Such acquisitions are structured almost exclusively through net leases that maintain tenant responsibility for property expenses, thereby enhancing cash flow predictability [S26]. Furthermore, the company relies on its external Adviser’s expertise to execute due diligence focused on property valuations inclusive of local comparable rents, replacement costs, and flexibility for future leasing conversions—traits critical for unlocking value in these non-primary markets [S24].
Capital Structure Evolution: Upsizing Credit Facilities Amid Refinancing
Gladstone continues prudent leverage management through its multi-tranche credit facility comprising Term Loans A/B/C and an unsecured revolver totaling over $430 million drawn as of December 31, 2025 [S4][S6][S7]. The revolver was upsized multiple times during 2025—with the latest increase bringing it to $200 million maturing October 2029—and term loans extended correspondingly with maturities stretching into early 2030 [S6][S21].
The weighted average interest rate on mortgage debt is approximately 4.21%, while the blended cost of all debt instruments stands near 5.21%, reflecting a mix of fixed-rate mortgages and floating rate term loans with various interest rate caps to mitigate LIBOR/SOFR volatility risk [S7][S12]. This non-recourse mortgage financing strategy limits systemic risk exposure solely to encumbered properties rather than the broader asset base [S7].
These refinancings also incurred fees around $4-4.5 million but provided enhanced financial flexibility potentially lowering liquidity risk amid uncertain credit market conditions [S6][S13]. Additionally, private placements such as the issuance of $85 million senior unsecured notes maturing in 2030 replace short-term Revolver usage thereby smoothing debt maturity profiles [S20].
Shareholder Returns: Dividends Supported by Cash Flow, Buybacks on Pause
Despite the net income softness in FY2025, Gladstone maintained consistent dividend payouts totaling over $68 million for common and preferred shareholders combined [F1][S22][N3]. Dividend policy is sustained primarily by strong operating cash flows rather than reported net income fluctuations alone—a typical practice among REITs reliant on Funds From Operations (FFO) equivalents.
Notably, the company ceased repurchases of common stock during recent years reflecting prioritization of cash towards acquisitions and debt reduction rather than share buybacks [F1][S22]. Historically modest buyback activity last occurred in FY2023 with approximately $1 million spent before pausing thereafter.
Overall dividend coverage ratios appear healthy given the sizeable CFO increase outpacing dividend growth—affording distribution sustainability barring material operational shocks.
Risks Remain: Tenant Credit, Lease Renewals, and Interest Rate Sensitivities
Underlying risks highlighted explicitly in SEC filings include tenant credit quality challenges where some lessees could default or delay rent payments potentially disrupting distributable cash flow [S1][N7]. Given net leases generally preclude landlord operating expenses but depend heavily on tenant solvency for rental collections this remains paramount.
Lease renewal uncertainties pose further downside if expiring leases cannot be renegotiated at or above prevailing market rents—net lease tenure averaging mid-to-high single-digit years leaves renewal exposure notable over the medium term [S1]. Moreover, potential downward market pressure from excess office space challenges fleet utilization post-pandemic could constrain some rent escalations especially in office holdings.
Rising interest rates constitute a material earnings headwind given substantial variable rate floating debt components despite hedges such as interest rate swaps and caps on portions of Term Loans A-C [S7][S12][N7]. Spikes beyond current swap levels would increase financing costs rapidly absent further derivative adjustments.
What to Monitor: Upcoming Milestones, Lease Expirations, and Debt Maturities
Investor focus should track scheduled maturities across mortgage notes payable which aggregate near $35 million due in FY2026 and an additional $95 million approximately due throughout FY2027—these balloon payments require refinancing or repayment strategies that could materially affect liquidity if disrupted [S25][S28].
Lease expiration schedules warrant scrutiny given staggered terms within the portfolio; upcoming rollovers test Gladstone’s ability to renew leases under favorable terms sustaining occupancy above current near-maximum levels (99%) [N1][S9]. Monitoring external Adviser decisions impacting acquisition pace or disposition plans will provide insight into management’s directional views.
Meanwhile disclosure timings for quarterly earnings releases including updates to NAV estimates or FFO guidance would offer lenses into operating momentum relative to external economic conditions shaping demand fundamentals.
Disclaimer: This analysis is provided solely for informational purposes based on publicly available data as of February 2026 without any investment advice or recommendation whatsoever.
Disclaimer: This is research-only, informational analysis and not investment advice. It may include AI-generated interpretation and general industry context. Always verify important details using primary sources.
Comments