
How Oceaneering International Leverages Robotics Fleet and Cash Flow for Growth Resilience
Oceaneering’s extensive ROV fleet and disciplined cash flow management underpin its strategic maneuvering amid offshore energy market shifts.
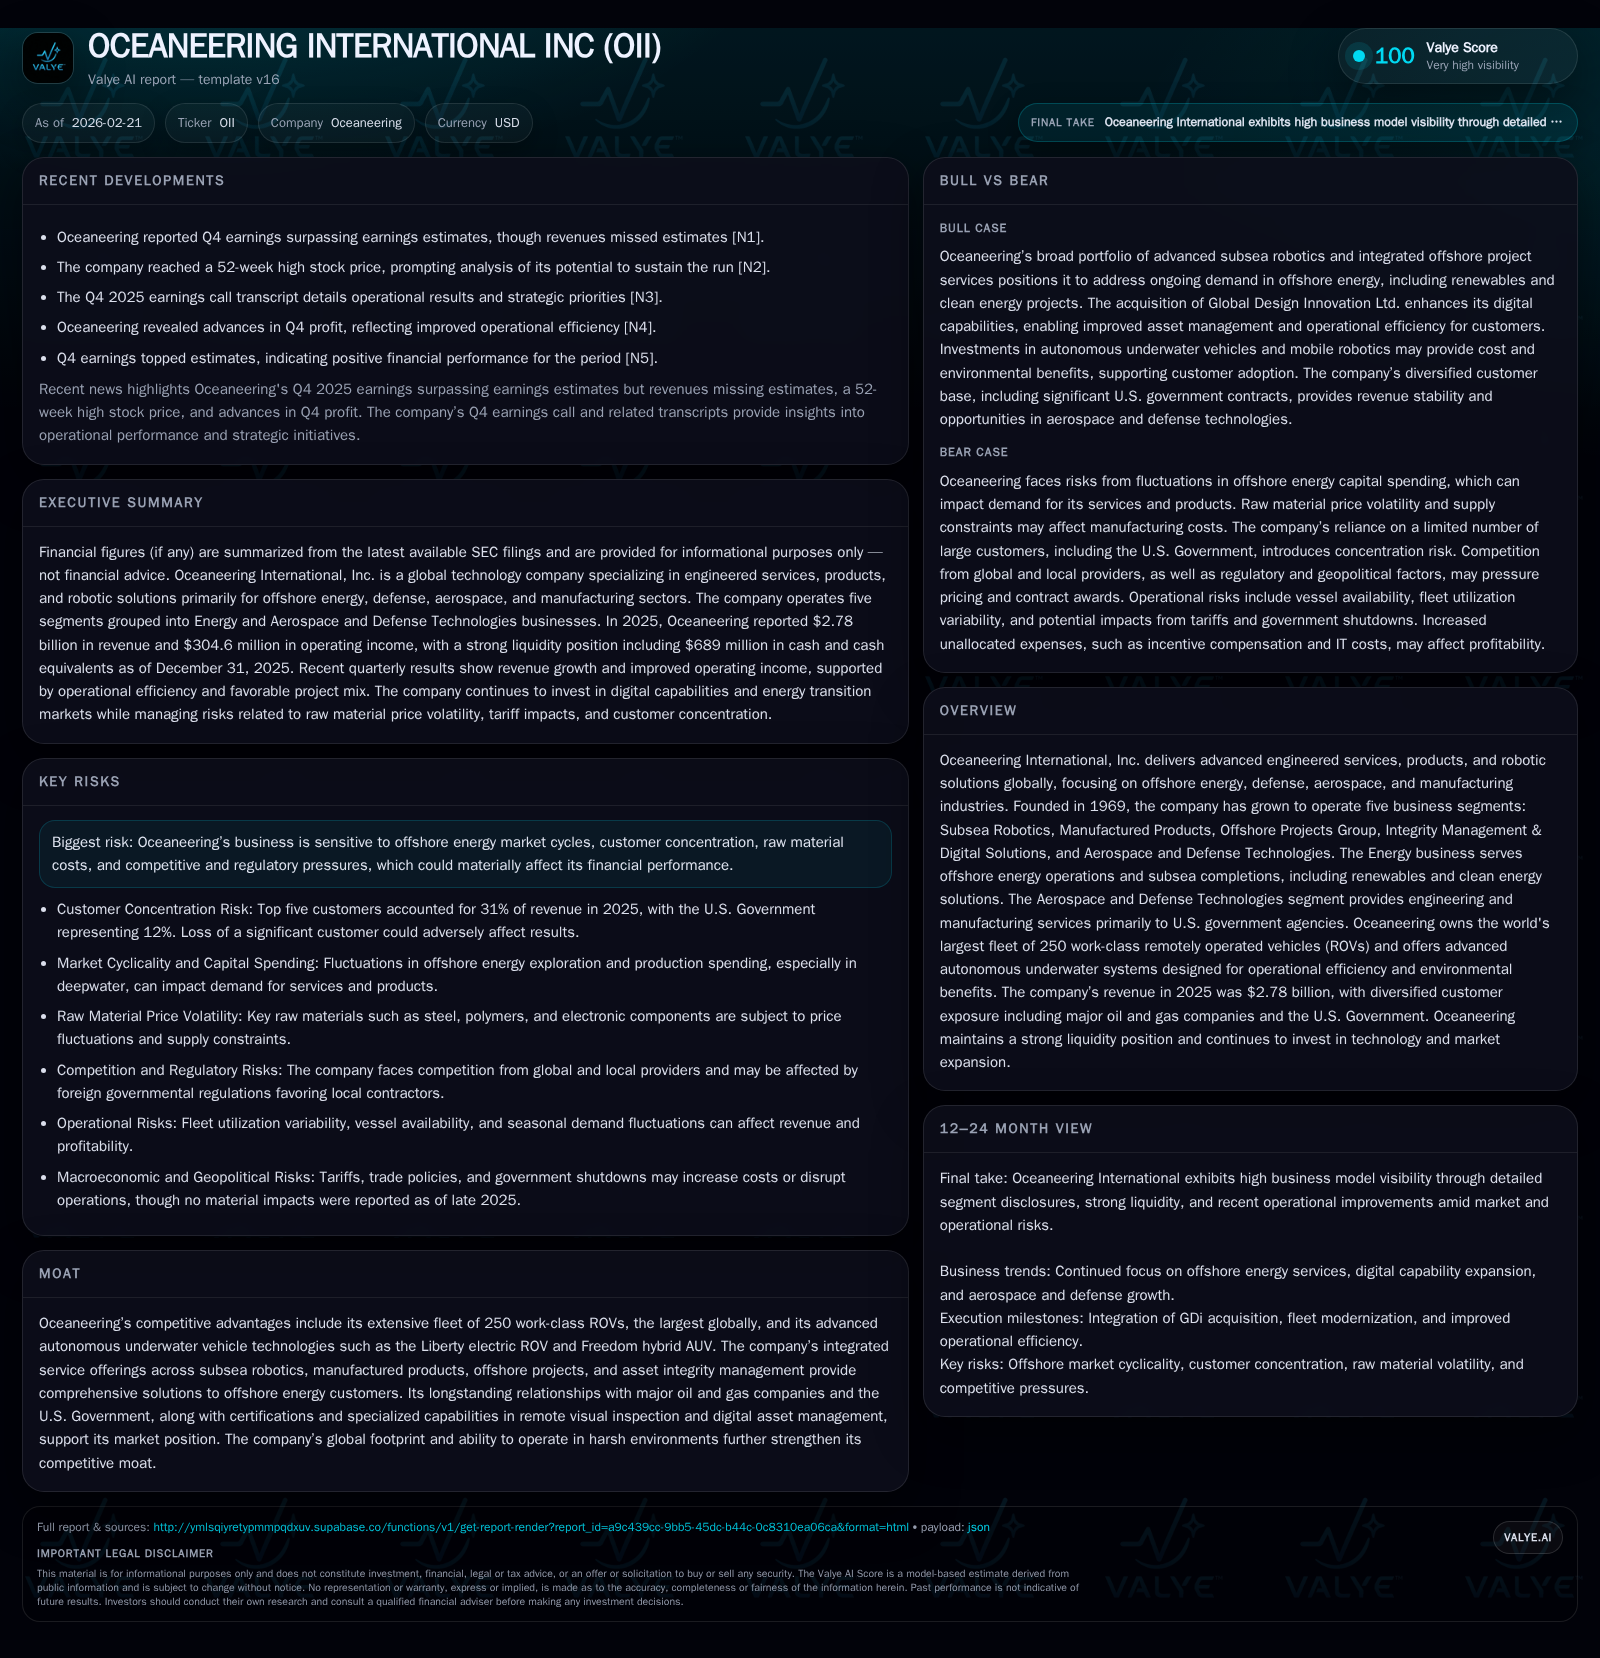
Oceaneering International demonstrated solid revenue growth of 4.6% in fiscal 2025, driven largely by its Subsea Robotics and Aerospace segments amidst a complex offshore energy environment. The company leverages the world’s largest fleet of 250 work-class ROVs alongside recent digital capabilities expansions to maintain operational strength. Strong operating cash flow, which surged 56.9% year-over-year, supports an increasingly balanced capital allocation strategy emphasizing share buybacks and selective investments. While market cyclicality and tariffs pose risks, Oceaneering’s backlog, advanced vehicle innovations, and government contracts offer key visibility into near-term resilience.
Fiscal 2025 Performance: Revenue Expansion Backed by Segment Strength
Oceaneering International posted a solid performance in fiscal year 2025 marked by a 4.6% increase in total revenue to approximately $2.78 billion and a significant jump in operating income of nearly 24%, reaching $305 million [F1]. This improved earnings performance contrasts with earlier years of more volatile results, highlighting effective operational leverage gains through improved pricing environments and higher activity levels across most reporting segments except Integrity Management & Digital Solutions (IMDS) which saw marginal softness [N1][N3][S1]. The company navigated cyclical offshore energy headwinds while expanding margins, sustained by favorable contract structures predominantly dayrate-based for ROV deployments that enable flexibility around weather or operational interruptions [S16][S17]. This top-line resilience reflects Oceaneering's ability to capitalize on both volume and price realizations amid a patchy recovery in offshore developments globally.
Historical performance (annual)
| FY | Rev ($bn) | CFO ($mm) | OpInc ($mm) | Capex ($mm) | Rev YoY |
|---|---|---|---|---|---|
| 2025 | 2.8 | 319 | 305 | 111 | +4.6% |
| 2024 | 2.7 | 203 | 246 | 107 | +9.8% |
| 2023 | 2.4 | 210 | 181 | 101 | +17.4% |
| 2022 | 2.1 | 121 | 111 | 81 |
Note: Omitted columns lack sufficient annual XBRL coverage in the provided tags (need ≥2 annual points): Net, Div, ROE%. Source: SEC companyfacts cache [F1].
Capital returns and efficiency (annual)
| FY | Buybacks ($mm) | FCF ($mm) |
|---|---|---|
| 2025 | 40 | 208 |
| 2024 | 20 | 96 |
| 2023 | 109 | |
| 2022 | 40 |
Source: SEC companyfacts cache [F1].
*Note: Earlier years’ OpInc growth rates included for context.
Key Business Drivers: Subsea Robotics, Offshore Projects, and Emerging Digital Focus
The core pillar remains the Subsea Robotics segment where Oceaneering operates the world's largest fleet of approximately 250 work-class remotely operated vehicles (ROVs), driving essential subsea services such as drill support, pipeline inspection, subsea installation, maintenance, repair (IMR), and survey operations [S11][N2]. Dayrate contracts typical for these assets balance utilization rates against weather dependency and equipment downtime — all manageable given the scale of fleet deployment.
Offshore Projects Group (OPG) provides subsea installation, riserless light well intervention, diving services, project management and drill pipe riser solutions primarily concentrated in the US Gulf of Mexico and West Africa although signs point to future softening in those regions for calendar year '26 [S23]. Meanwhile, the acquisition of Global Design Innovation Ltd. (GDi) late in Q4’24 marked a significant step forward for the Integrity Management & Digital Solutions segment — integrating digital asset management software certified for advanced remote visual inspection employing point cloud data — expanding Oceaneering’s engineering-driven technology footprint into predictive integrity monitoring services with industrial applications beyond oil & gas [S1][S21].
Evolving Market Dynamics: Energy Transition and Aerospace Contributions
While offshore hydrocarbon exploration remains the dominant revenue contributor at over three-quarters of total sales, a nuanced shift towards supporting clean energy solutions such as offshore renewables and mobility solutions is apparent. Oceaneering positions its robotics technologies to operate effectively across these emerging sectors while maintaining traditional oilfield service revenue streams [S1][S23].
The Aerospace and Defense Technologies (ADTech) segment expanded its portfolio notably during the year with revenues increasing by approximately 17% in '25 to $460 million driven primarily by continuing engineering services and manufacturing contracts for U.S. government agencies including Navy systems modernization and NASA-related space exploration support activities. This non-cyclical business stream diversifies the company's exposure beyond commodity-sensitive energy markets aiding stability across cycles [S16][S22].
Backlog, ROV Utilization, and Technological Advancements to Watch
At year-end '25 Oceaneering reported $511 million backlog within its Manufactured Products segment which provides visibility though some uncertainty persists due to volatile offshore project timing [S23]. While overall ROV utilization details are proprietary, management commentary from Q4 earnings calls underscored stable pricing discipline paired with slight volume growth in tooling and survey operations contributing to consistent segment margins [N2].
Technological innovation progresses with deployment plans underway for Liberty electric ROVs — designed for lower emissions footprint — alongside Freedom hybrid autonomous underwater vehicles enhancing operational efficiency through increased autonomy reducing vessel time requirements [S1]. These advancements align with industry-wide trends favoring asset electrification and autonomous robotic platforms to improve cost structures while meeting environmental regulatory expectations.
Capital Deployment Review: Cash Flow Generation, Share Buybacks, and Investment Priorities
Cash flow generation delivered notable improvements with net operating cash flow surging nearly 57% year-over-year to approximately $319 million thanks to increased profitability combined with working capital efficiencies [F1][S24]. Capital expenditures edged up modestly by ~3.6% year-over-year totaling about $111 million reflecting targeted investments in technology upgrades and fleet maintenance rather than broad expansion [F1][S12][S26].
Oceaneering’s share repurchase activity doubled compared to prior years with $40 million deployed during fiscal '25 under a Board-authorized program resumed since late '24—signifying management focus on capital returns amid limited dividend payouts reflecting sector cyclicality norms [F1][S15]. Dividends paid data is not available from provided tags.
This disciplined allocation underscores prioritization of free cash flow conversion over yield distribution common among offshore services operators.
Balance Sheet Positioning and Liquidity in a Volatile Sector
Financial position displays solid structural footing; the company holds nearly $689 million cash equivalents at year-end '25 yielding a current ratio close to two—indicative of ample near-term liquidity buffers—supported by an unused revolving credit facility totaling $215 million maturing in April '27 with zero drawn balances reported [F1][S5][S7][S8].
Oceaneering maintains compliance with all covenants embedded within long-term debt agreements related to its $500 million senior notes maturing in early '28 alongside revolving credit restrictions limiting secured indebtedness relative to consolidated tangible assets ensuring prudent leverage management critical given industry cyclicality risks [S18][S20].
Return on equity (ROE) is estimated at -13.8% based on latest annual equity versus last available net income data; however net income data is not current enough for precise recent profitability assessment as latest net income loss figure is from Q3 FY2018 per tags available [F1].
Risks from Market Cyclicality, Tariffs, Customer Concentration, and Regulatory Changes
Despite operational progress, risk factors loom large including inherent sensitivity to fluctuations in offshore exploration budgets influenced by global commodity prices impacting contract volumes and pricing power creating operating margin volatility risk exposure [S1][N1]. Raw material price inflation driven by U.S. tariffs particularly steel products utilized broadly across manufactured goods lines adds cost pressure uncertainties complicating margin stability forecasts [S2]. While customer diversification benefits exist with no single client exceeding ~10% revenue share except U.S. Government at roughly ~12%, concentration among top energy customers still represents collectability risk linked to sector downturns alongside U.S. DEFENSE contract funding fluxes influencing ADTech segment predictability [S14][N1][N2].
Navigating Forward: Indicators and Milestones for Sustained Growth
Looking ahead into calendar year ’26 guidance emphasizes moderate growth trajectories for subsea robotics supported by stable dayrate pricing coupled with higher tooling volumes offsetting softer OPG segment outlook due largely to U.S. Gulf activity contraction compensated partially by Caspian/Middle East/Brazil expansions; IMDS anticipates meaningful operating income gains through digital solution adoption further bolstered by steady progression within Aerospace/Defense government portfolio expansions representing less cyclical revenue base extension opportunities [S23].
Key future indicators will center on quarterly backlog updates reflecting real-time project awards particularly within subsea products as well as capital expenditure commitments revealing pace towards new autonomous robotic system rollouts embracing electrification objectives keyed towards better cost efficiency metrics tied directly to environmental regulations compliance benchmarks outlined by customers. Monitoring fleet composition including upcoming retirements or planned additions remain critical given their direct impact on utilization dynamics influencing dayrate contract negotiating leverage moving forward.
This analysis synthesizes publicly filed SEC disclosures, earnings call summaries, recent news reports, and detailed financial data points without providing investment recommendations or forward-looking price forecasts. All financial figures conform strictly to reported facts without speculative extrapolations beyond source documents.
Disclaimer: This is research-only, informational analysis and not investment advice. It may include AI-generated interpretation and general industry context. Always verify important details using primary sources.
Comments