
GPO Plus, Inc. Leverages Tech-Driven DSD Model to Consolidate Convenience Store Distribution
GPO Plus, Inc. employs its proprietary PRISM+ platform and targeted regional hubs to streamline fragmented convenience store product distribution in the Midwest.
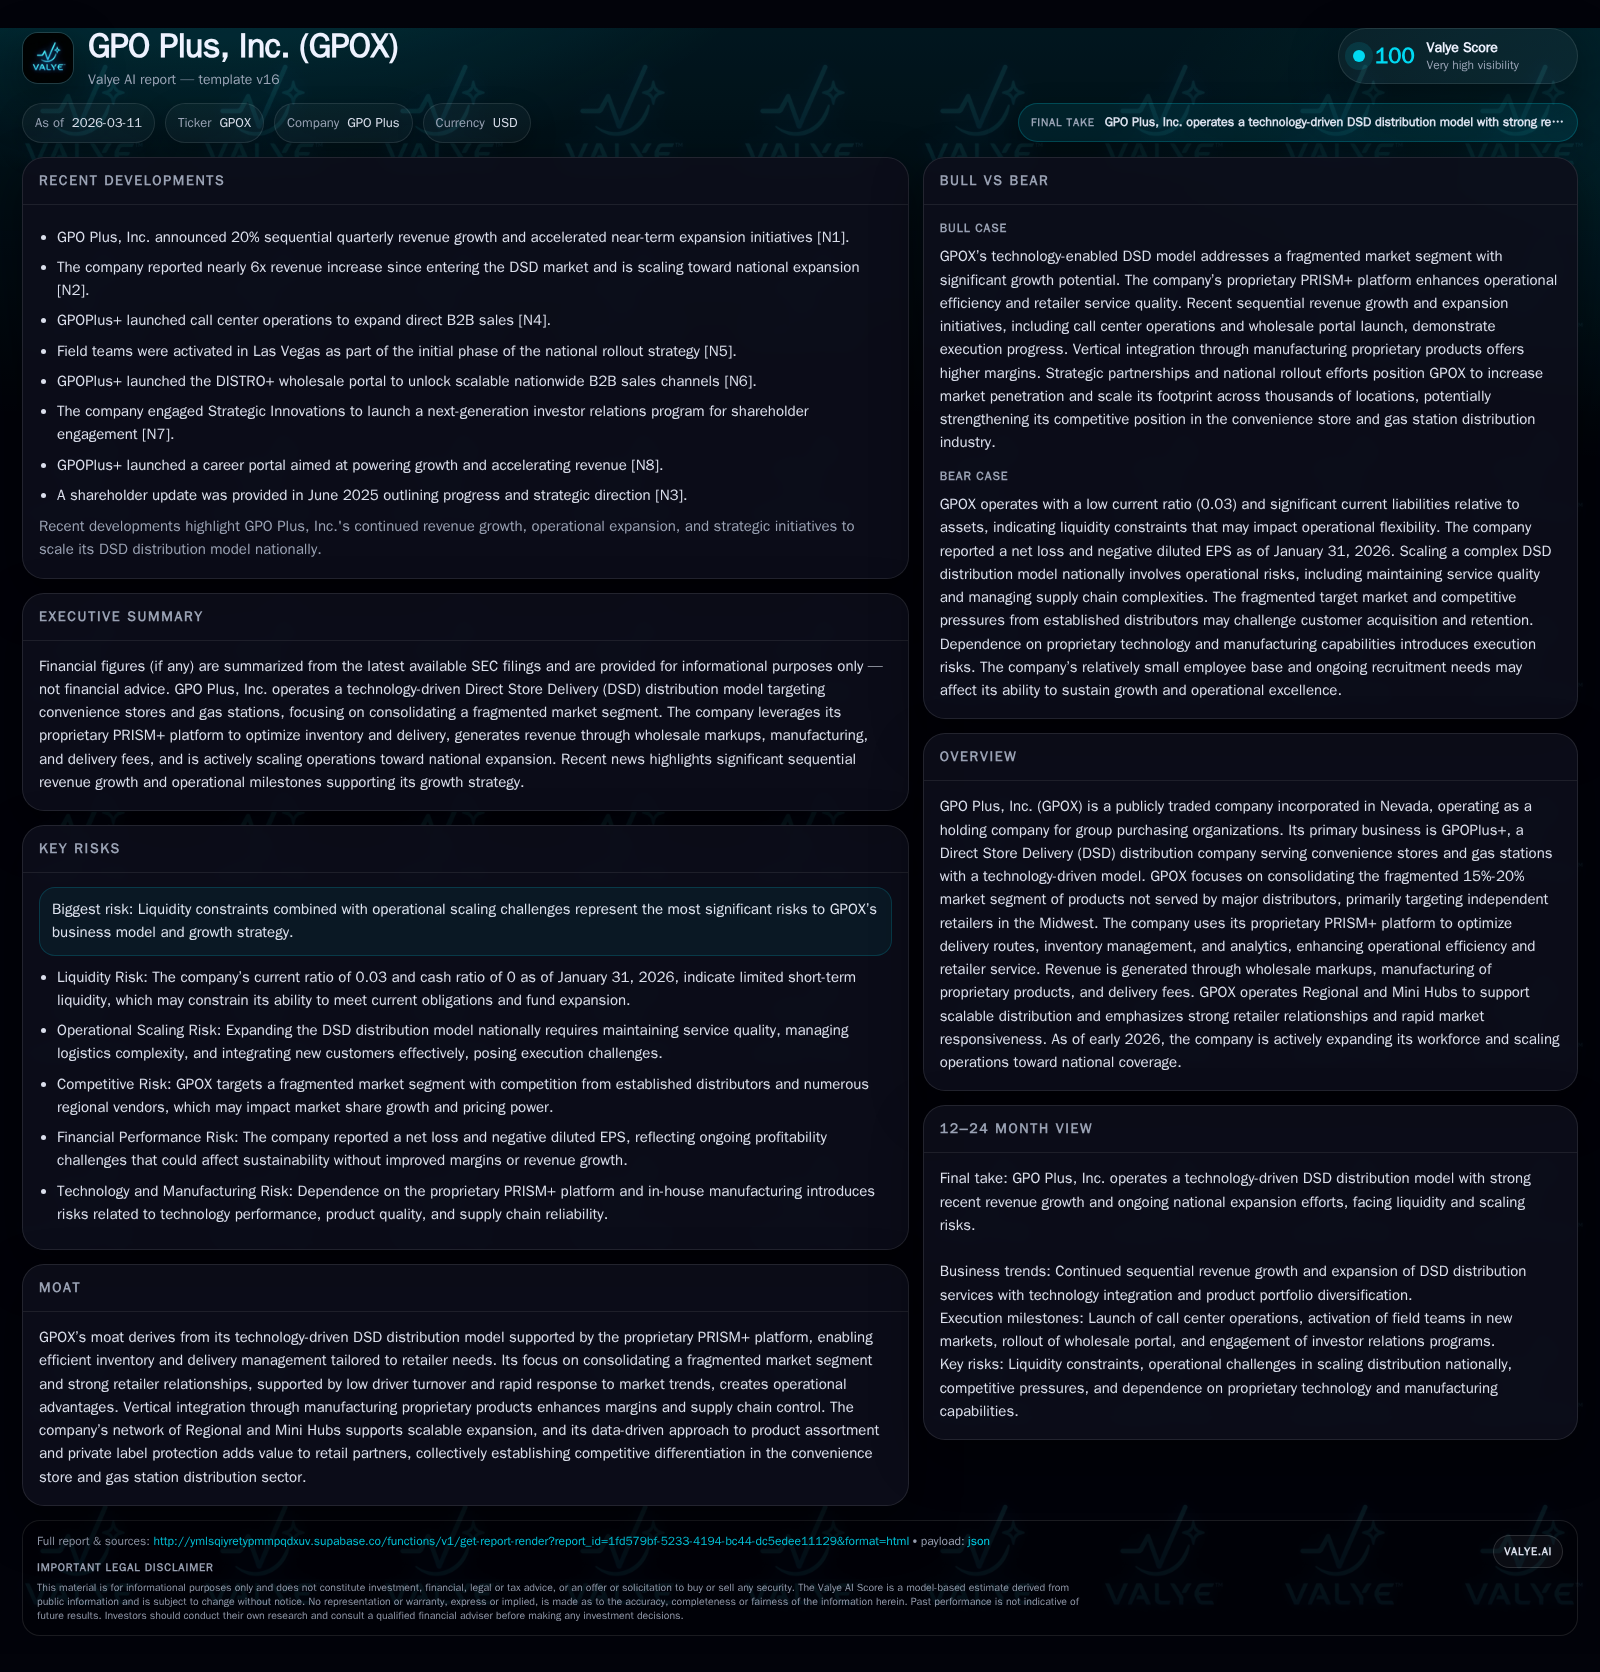
GPO Plus, Inc. (GPOX) has evolved from its origins into a technology-centric Direct Store Delivery (DSD) distributor focusing on underserved convenience store segments in the Midwest. Leveraging its proprietary PRISM+ platform and a network of Regional and Mini Hubs, GPOX targets the fragmented 15%-20% market share not served by broadline distributors by offering weekly DSD services combined with proprietary product manufacturing. Despite solid revenue growth near 9% year-over-year through FY2025, the company continues to operate at a loss due to scaling investments and liquidity constraints. Operational efficiencies driven by vertical integration and data analytics underpin its moat, but execution risks tied to cash flow remain pivotal as GPOX plans expansion beyond its core geography.
From Startup to Disruptor: Historical Growth and Key Drivers
Originally incorporated in Nevada in 2016 under a different business model, GPO Plus, Inc. transitioned into a publicly traded holding company focused on group purchasing organizations (GPOs), now operating primarily through GPOPlus+, its Direct Store Delivery (DSD) distribution arm targeting convenience stores and gas stations. Since pivoting to this model, GPOX has emphasized leveraging technology combined with close retailer collaboration to carve out a distinct niche in an otherwise fragmented market.
From FY2022 through FY2025, GPOX grew annual revenue from approximately $1.16 million to $4.74 million—an average year-over-year increase near 60% initially accelerated by scaling efforts with a moderation to roughly 9% growth in the latest fiscal year [F1]. This revenue upswing reflects increased market coverage across the Midwest region coupled with expansion in proprietary and vendor-backed product offerings.
Key drivers have included establishing weekly delivery routes directly servicing independent retailers who traditionally lacked tailored service options from super-regional or broadline distributors. Constant engagement allows GPOX not only to optimize inventory levels on a store-by-store basis but also to refine product mix through active collaboration with vendors and brands. This direct feedback loop is particularly valuable given that independent operators comprise over 60% of U.S. convenience stores as of recent industry data cited within filings [S3][S4].
Operating income trends reveal persistent losses despite revenue momentum; however, the continuing reduction in operating loss—falling approximately 20% year-over-year between FY2024 and FY2025—signals incremental progress toward operational leverage amid scaling challenges [F1]. The company reports capital expenditures directed toward enhancing infrastructure such as Regional and Mini Hubs which support scalability.
Historical performance (annual)
| FY | Rev ($mm) | Net ($mm) | CFO ($) | OpInc ($mm) | Rev YoY | Net YoY |
|---|---|---|---|---|---|---|
| 2025 | 5 | -4 | -1043037 | -3 | +8.9% | +12.2% |
| 2024 | 4 | -5 | -1381751 | -4 | +566.6% | -22.4% |
| 2023 | 1 | -4 | -1338214 | -4 | -43.8% | +86.4% |
| 2022 | 1 | -30 | -414623 | -29 |
Source: SEC companyfacts cache [F1].
Capital returns and efficiency (annual)
| FY | FCF ($) | ROE% |
|---|---|---|
| 2025 | -1110911 | 59.5 |
| 2024 | -1441254 | 90.4 |
| 2023 | 104.5 | |
| 2022 | -414623 | 1109.3 |
Source: SEC companyfacts cache [F1].
Revenue growth driven largely by expanded geographic coverage and broader product portfolio; operating losses narrowing but significant net losses persist amid scale-up costs.
PRISM+ Platform and Vertical Integration: Engines of Efficiency and Margin Expansion
At the heart of GPOX’s operations lies its proprietary PRISM+ (Predictive Route, Inventory, and Service Management) platform—a critical differentiator supporting efficient delivery logistics designed specifically for DSD distribution in the convenience retail channel [S5][S7]. The technology enables complex route optimization algorithms that minimize last-mile delivery costs while maintaining high service frequency tailored to fast-moving consumer goods (FMCG).
Beyond routing efficiencies, PRISM+ offers inventory analytics that provide category managers granular insights into SKU velocity trends across stores. This facilitates planogram compliance monitoring—ensuring retail shelf configurations maximize sales opportunities consistent with brand agreements—and precise inventory replenishment aligned with real-time demand profiles.
Vertical integration extends through manufacturing select proprietary products where margins are materially superior compared to conventional wholesale markups [S3][S5]. Producing in-house allows GPOX enhanced supply chain control reducing exposure to supplier disruptions common in fragmented retail markets while protecting private label assortments from encroachment by national brands.
Together these capabilities culminate in improved cost structures for store operators who benefit from labor savings (no pallet breakdown or manual stock inputs), optimized shelf space use via dynamic assortment curation reflecting shifting consumer preferences prevalent among convenience store shoppers [S3][S8]. This integrated model enhances both margin potential for GPOX and value delivered to retail partners.
Targeting the Midwest Fragmented Market: Opportunity and Competitive Positioning
GPOX has strategically concentrated its efforts within the Midwest corridor—a region historically underserved by super-regional distributors for approximately 15%-20% of products sold at gas stations and convenience stores [S4][S9]. This segment remains highly fragmented with dozens of small vendors often deploying less frequent drop-ship models that do not adequately address local retailer needs.
The company’s weekly DSD service coupled with dedicated Regional and Mini Hubs infrastructure allows penetration into independent store networks comprising over 60% of outlets nationwide—a substantial untapped customer base seeking reliable inventory replenishment along with private label protection where major chains dominate shelf space [S9].
Low driver turnover rates highlighted by management translates directly into strong retailer relationships fostering consistent communication channels for timely inventory adjustments responsive to shifting market trends or regulatory changes impacting FMCG categories like tobacco alternatives or convenience food items [S4]. This frontline loyalty is essential given the labor-intensive nature of last-mile deliveries requiring on-site service quality assurance alongside promotional support.
The hub-and-spoke model enabling multiple point sourcing also supports geographic scale without proportionately increasing fixed costs—a cornerstone for achieving operational leverage as rollout expands beyond initial markets.
Assessing Financial Performance: Revenue Growth Against Persistent Operating Losses
Despite steady top-line gains nearing $4.75 million by FY2025—a near-9% increase year-over-year—the P&L reveals continuous operating deficits highlighting significant investment costs related to network buildout and technology enhancements [F1]. Operating income improved from near -$4 million in FY2024 to about -$3.2 million in FY2025 but remained substantially negative.
Net losses followed a similar pattern decreasing roughly 12% since prior fiscal periods yet reflecting ongoing funding needs for capex supporting fleet growth, warehouse expansions, workforce additions primarily centered around driver recruitment/training initiatives critical for sustaining low turnover metrics [F1].
Operating cash flow deficits increased marginally compared with prior years though showed signs of slight improvement indicating early returns on capital invested are beginning albeit well short of breakeven levels necessary for self-sustaining free cash flow generation (-$1.11 million FCF after capex in FY2025).
The financial structure evidences high leverage points driven by negative equity exceeding $7 million at fiscal year-end coupled with minimal cash reserves totaling under $18 thousand versus current liabilities surpassing $6.6 million indicating severely constrained liquidity; hence solvency risks require vigilant monitoring as the firm executes its growth agenda amidst challenging capital market conditions [F1][S16][S20].
Capital Allocation Priorities: Liquidity, Cash Flow Challenges, and Investment Trajectory
Capital deployment emphasizes expanding physical infrastructure underpinning distribution capability such as Regional Hubs strategically located across the Midwest supported by smaller Mini Hubs enabling last-mile flexibility aligned with diverse retailer formats ([S7], [F1]). Annual capex hovered around $68 thousand in FY2025 marking growth investments while balancing limited available funds.
Liquidity remains precarious shaped by a working capital deficit where current liabilities vastly outstrip current assets producing a dismal current ratio of roughly 0.03 as of January 2026—a red flag signaling potential constraints ahead if operating losses continue unabated or external financing options tighten ([F1], [S16]). Equity remains deeply negative presenting a distorted ROE figure skewed numerically by negative book value despite improving net income figures that nominally indicate upward trajectory ([F1]).
No dividends or share repurchase programs are evident reflecting management focus squarely on preserving cash resources for core operations rather than shareholder returns ([S12], [S18]). The firm’s cautious approach aligns appropriately given ongoing scale-up challenges articulated within risk disclosures emphasizing liquidity concerns alongside execution risks intrinsic to rapid expansion ([S10], [S13], [S14], [S15]).
Growth Prospects Amid Operational Scaling and Market Dynamics
Forward-looking ambitions center on extending coverage well beyond their existing Midwest footprint targeting serviceable locations upward of 20,000 stores nationwide once operations stabilize ([S9]). The scalable nature of their hub-and-spoke model aided by technological sophistication promises potential expedited entry into new regions contingent upon achieving critical mass thresholds necessary for sustainable economics.
However, absent explicit guidance or detailed milestone disclosure within SEC filings or press channels leaves forecasts subject primarily to qualitative assessment based on stated strategic priorities combined with operational realities including labor availability for drivers and capital access constraints ([N/A]).
Expanding national reach would require careful navigation of competitive intensity given entrenched broadline distributors controlling significant majority market share (~80%-85%), necessitating continued emphasis on niche consolidation tactics focusing on specialized SKUs underserved within legacy systems ([S9]).
Monitoring Milestones and What to Watch Next
Indicators critical for assessing progress include:
- Continued reduction in operating loss margins signaling improved cost absorption at scale,
- Movement towards positive free cash flow reflecting better working capital management internally,
- Maintenance of low driver turnover preserving differentiated customer service levels ensuring planogram fidelity,
- Broader penetration of proprietary manufactured products contributing an increasing share of overall revenue streams,
- Evolution and adoption enhancement of PRISM+ platform functionalities enabling deeper predictive analytics driving inventory optimization across multi-location accounts.
These metrics will help clarify whether GPOX's ambitious goals can reconcile growth aspirations with pragmatic capital limitations inherent at this stage.
This analysis relies exclusively on filings up through March 11, 2026; no public forward guidance was found contemporaneous within SEC documents or news sources cited here. All financial data is sourced directly from SEC filing evidence without extrapolation beyond reported figures. Operational commentary draws upon detailed business disclosures containing descriptions specific to GPO Plus's distribution model within convenience retail grocery channels. Investors should consider liquidity status carefully when evaluating valuation assumptions absent further updates.
Disclaimer: This is research-only, informational analysis and not investment advice. It may include AI-generated interpretation and general industry context. Always verify important details using primary sources.
Comments