
Hyatt Hotels Advances Fee Revenue and RevPAR Gains Amid Liquidity Pressure
Q2 2026 results highlight Hyatt’s fee-based growth and operational resilience within a challenging liquidity backdrop.
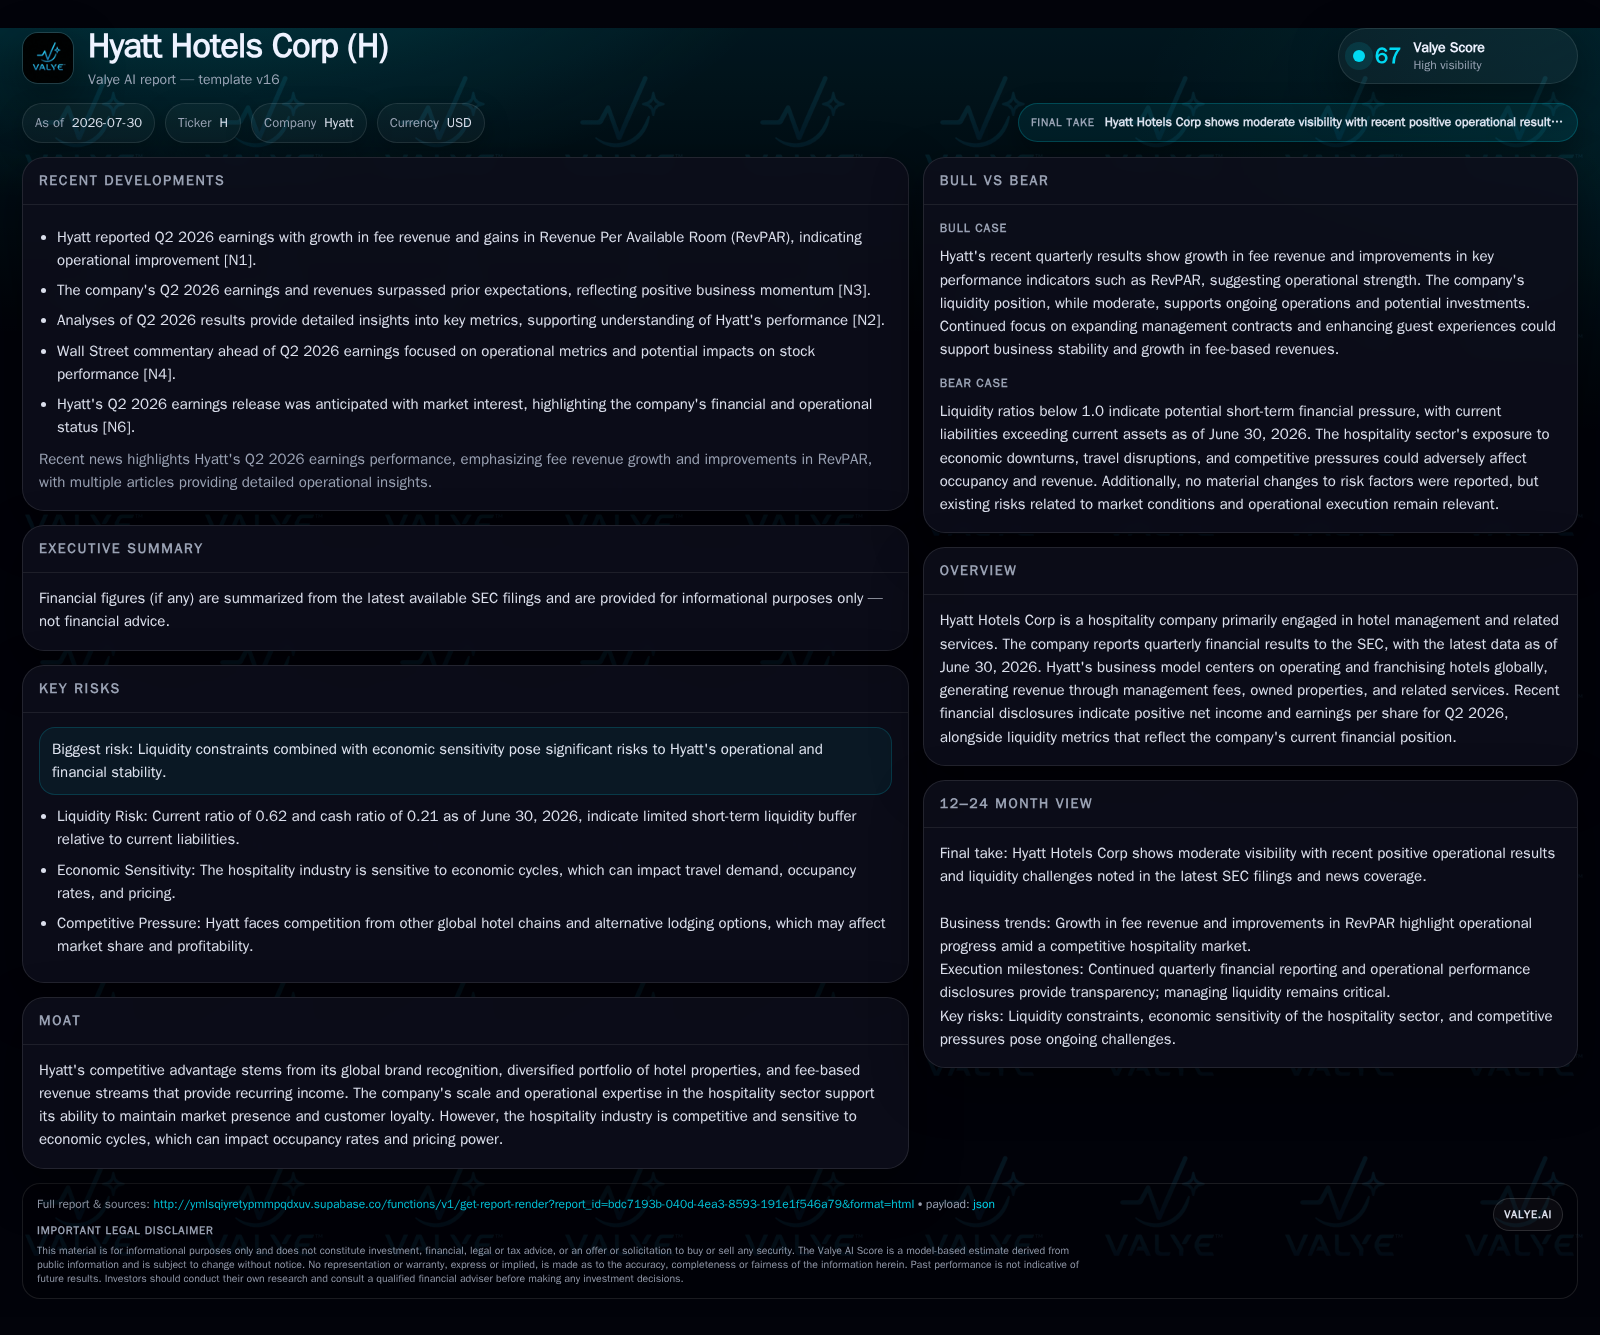
Hyatt Hotels Corp reported a second-quarter 2026 financial update reflecting solid gains in management and franchise fee revenue, driven by improvements in key operating metrics such as RevPAR and occupancy. The company’s diversified model, combining owned hotels with fee-based management and franchising services, sustains recurring revenues despite macroeconomic uncertainties impacting travel demand. However, current liquidity ratios remain constrained, implying ongoing financial discipline is critical for funding growth. Hyatt’s competitive position leverages brand strength and global scale, but watchpoints remain on economic sensitivity, debt levels, and capital allocation amid travel industry cyclicality.
Recent Operating Update: Q2 2026 Performance Reflects Fee Growth and RevPAR Strength
Hyatt Hotels Corporation's Q2 2026 filing reveals a company capitalizing on improving hospitality demand to grow its fee-based revenue streams. Management commentary indicates that base management fees expanded alongside incentive fees tied to rising hotel profitability. These gains correlate closely with reported increases in key operating performance metrics such as Revenue per Available Room (RevPAR) and occupancy rates across the company's portfolio [S2]. External earnings coverage confirms that results surpassed analyst expectations due principally to this fee growth coupled with steady owned property contributions [N1][N3]. This strong top-line performance underlines Hyatt's ability to leverage operational momentum during still recovering broader travel markets.
From an operational perspective, RevPAR serves as a critical KPI because increases reflect both higher occupancy rates and improvements in Average Daily Rate (ADR), signaling pricing power alongside volume recovery. Hyatt’s emphasis on upper-upscale and lifestyle brands appears to be enabling it to capture more premium traffic and reduce vulnerability to discount-driven competition [S1]. This is consistent with industry trends where travelers are favoring experiential stays post-pandemic.
Business Model: Hybrid Ownership Supporting Recurring Fee Revenues
Hyatt's business model combines ownership of select properties with extensive management contracts and franchising arrangements globally. Revenue derives primarily from management fees (base plus incentive), franchise fees from third-party hotel owners, income from owned hotels' operations including ancillary services like food & beverage, event hosting, as well as cost reimbursements [S1]. This hybrid model benefits from recurring fee income streams less capital intensive than full ownership alone, enriching margins while spreading economic risk.
Fee-based revenues offer relative stability due to contractual structures where fees are generally percent-of-revenue or profit-linked. Incentive fees align Hyatt’s interests with property performance, providing upside during cyclical recoveries like the present [S1]. Owned assets provide additional control over customer experience but expose the company to higher fixed costs and capital expenditure requirements.
Channel-wise, Hyatt sells through direct bookings supplemented by third-party online travel agencies (OTAs), corporate contracts for business travel, group/event sales, and loyalty platform engagement—a strategic asset for repeat business driving enhanced RevPAR through price premiums [S1]. Loyalty programs thus not only increase retention but feed into yield optimization across the portfolio.
Industry Structure and Competitive Position
Operating within the Hospitality and Hotel Management sector places Hyatt among large global chains like Marriott International and Hilton Worldwide competing on brand cachet, geographic diversification, operational efficiency, service quality, loyalty programs, and expanding fee-based contract portfolios. The industry is notably cyclical—sensitive to shifts in economic growth impacting discretionary leisure/business travel spending.
Hyatt’s scale—while smaller than some peers—supports meaningful geographic reach across North America, Asia-Pacific, Europe, Latin America, Middle East & Africa which aids in mitigating regional volatility risks [S1]. Its strong presence in premium/luxury segments enables pricing advantages relative to mass-market brands.
Operationally, continuous improvement in GOPPAR (Gross Operating Profit per Available Room) at managed hotels enhances Hyatt's incentive fee potential. Efficiency gains combined with technology investments streamline booking channels enhancing guest experience. Peer comparisons highlight Hyatt’s leaner footprint of owned properties relative to Marriott or Hilton REIT-affiliated portfolios favoring asset-light expansion pathways.
Growth Drivers
Substantial tailwinds stem from global economic stabilization fostering inbound tourism revival alongside increased corporate travel reactivation post-COVID restrictions easing. Rising disposable incomes in emerging markets propel luxury segment demand where Hyatt holds differentiated offerings.
Expanding loyalty program membership fuels direct booking growth reducing OTA commission dependency while delivering richer customer data analytics aiding personalized marketing efforts. In parallel, strategic acquisitions or ground-up developments in high-growth gateway cities create incremental room supply tailored to lifestyle trends.
Innovation in digital platforms enhances guest self-service capabilities potentially increasing booking conversion rates while refining operational cost structures. Multi-brand portfolio strategy addresses diverse traveler preferences—from luxury escapes to select-service urban stays—broadening market capture.
Risks and Watchpoints
The hospitality sector’s high sensitivity to economic downturns tempers revenue visibility; recessionary pressures could suppress occupancy rates reducing management/incentive fees materially. Exposure to geopolitical instability affects international tourist flows referencing uncertainty continues despite recent recovery signals.
Liquidity remains a constraint—current ratio near 0.62 indicates limited short-term asset buffers versus liabilities posing refinancing risks if credit markets tighten unexpectedly or operating cash flow falters [F1]. Total debt surpasses $4.3 billion against cash reserves approximating $537 million generates net leverage exceeding $3.7 billion necessitating disciplined free cash flow preservation.
Dependence on third-party hotel owners exposes Hyatt to risks around contract renewals and owner investment capabilities which may impact franchise/management footprint stability. Competition from alternative lodging platforms (e.g., Airbnb) persists as disruptive ambient pressure requiring ongoing brand differentiation investments.
Regulatory shifts around health/safety or environmental compliance introduce evolving cost factors while currency fluctuations influence international segment profitability.
What to Watch Next
Key milestones include quarterly updates on RevPAR trajectories especially in international regions recovering unevenly post-pandemic disruptions. Tracking management & franchise fee growth alongside incentive fee accruals will illuminate the sustainability of recent profitability acceleration.
Monitoring capital allocation actions such as share repurchases ($1 billion newly authorized) versus debt reduction priorities will clarify financial strategy amid constrained liquidity [S16]. Employee engagement scores or guest satisfaction benchmarks may serve as leading indicators projecting service quality trends influencing repeat patronage rates.
Guidance (if subsequently disclosed) around room supply additions or renovations would indicate pipeline renewal investments potentially catalyzing incremental future demand capture.
Financial Profile Discussion
As of June 30, 2026 Hyatt held cash & equivalents of approximately $537 million against total debt near $4.31 billion yielding net debt of about $3.77 billion [F1]. With current assets at roughly $2.04 billion compared with current liabilities of approximately $3.29 billion the resultant current ratio sits at a modest 0.62 indicating elevated short-term liquidity risk requiring close attention [F1].
This financial structure reflects the capital intensity inherent in owning significant hotel properties alongside supporting working capital needs for operations across diverse geographies.
Overall return metrics will hinge on maintaining robust margins via mix shifts toward high-fee segments coupled with cost discipline against a backdrop of cyclically sensitive demand patterns characteristic of the hospitality industry.
This analysis reflects insights derived solely from SEC filings dated through July 30, 2026 [S2], recent earnings press releases [S3], supplemental disclosures [S16], company facts snapshots [F1], external news coverage, combined with sector knowledge framing the hospitality industry's fundamental dynamics and key performance indicators vital for understanding Hyatt Hotels Corporation's evolving business positioning.
The article avoids speculative guidance projections or unverified operational details respecting evidence constraints while emphasizing contextually relevant risk factors shaping near-term execution challenges.
Disclaimer: This is research-only, informational analysis and not investment advice. It may include AI-generated interpretation and general industry context. Always verify important details using primary sources.

Comments