
HiTek Global’s Strategic Capital Raise and Reverse Split Mark Transitional Milestones
HiTek Global’s recent direct offering and 50-for-1 reverse stock split reflect a strategic repositioning amid evolving revenue streams and liquidity dynamics.
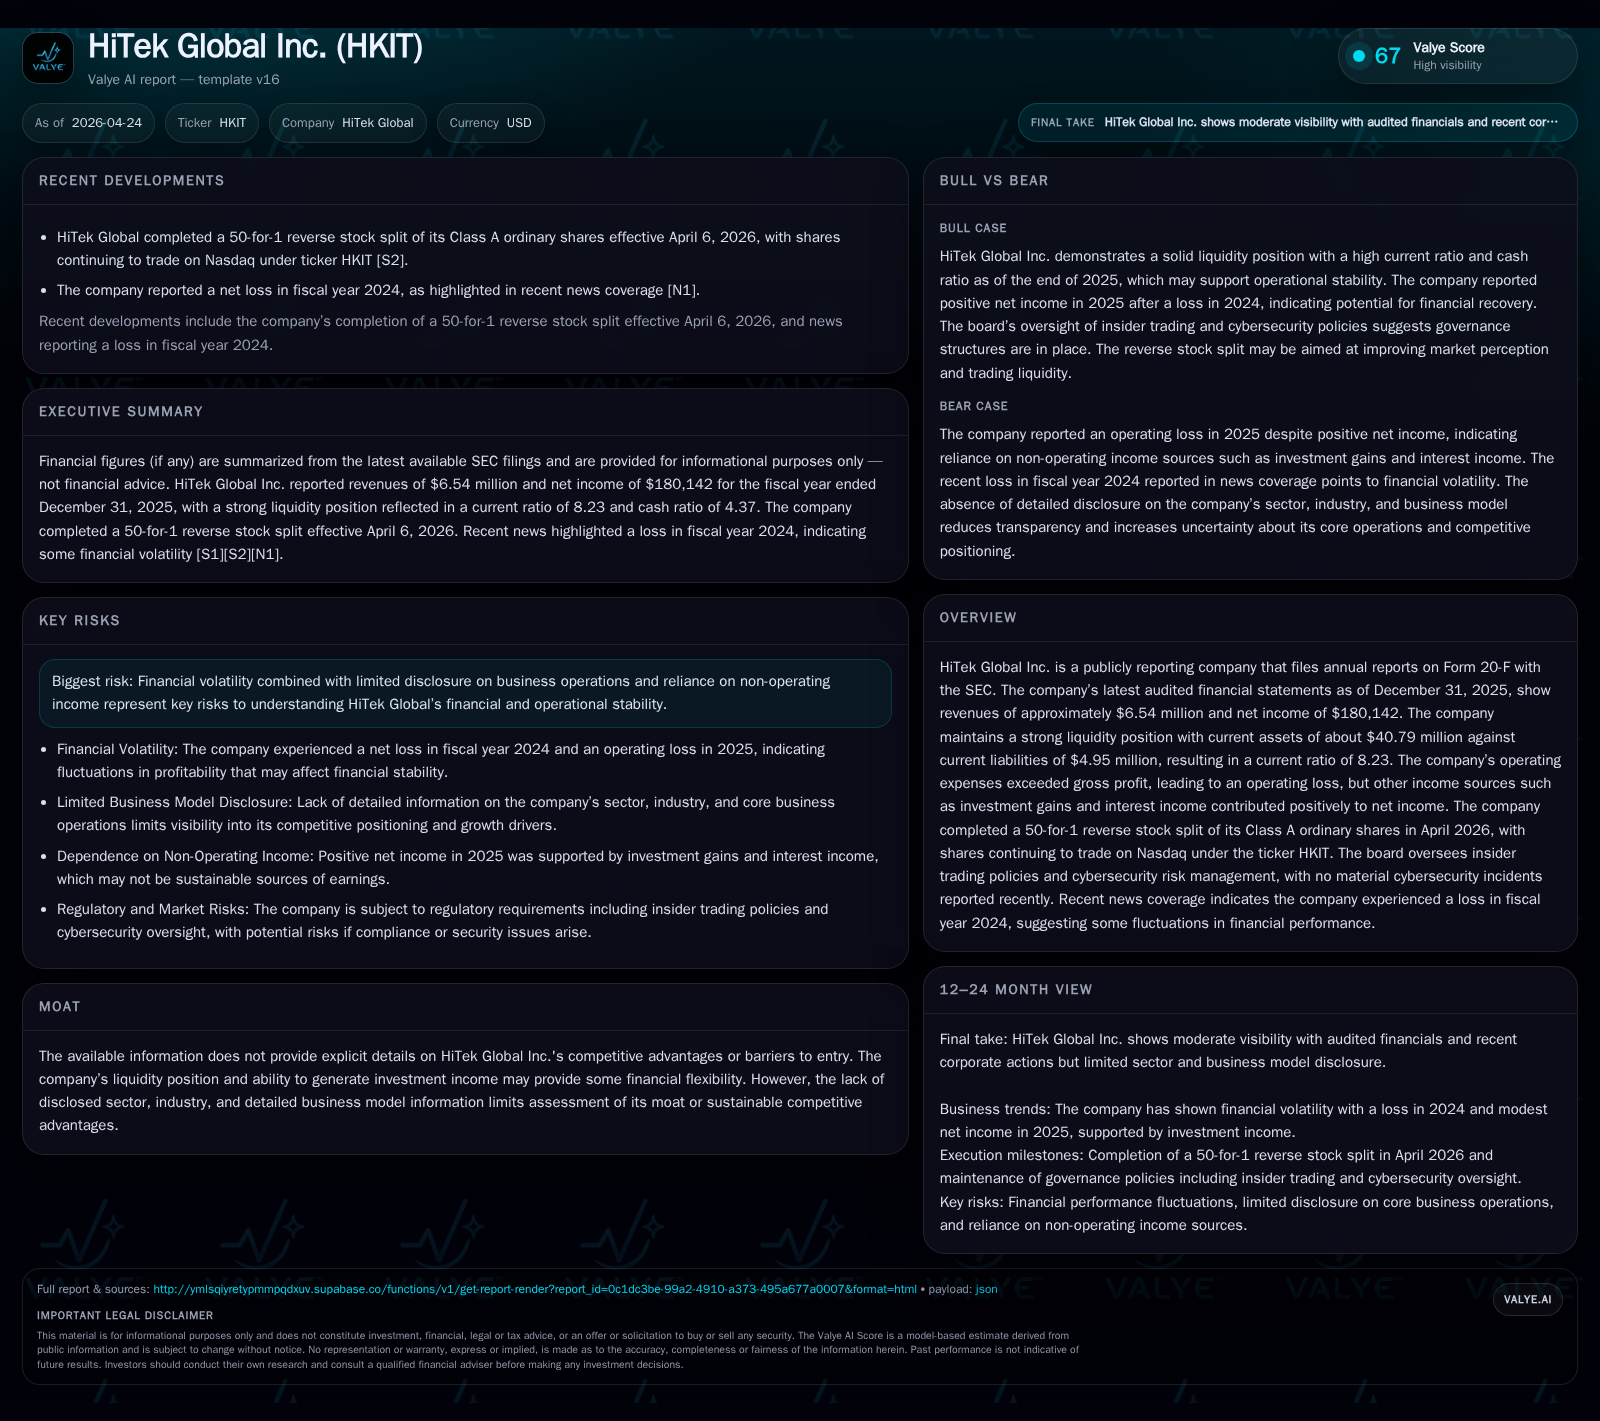
In Q1 2026, HiTek Global completed a $3 million registered direct offering coupled with a reverse stock split to strengthen capital resources and maintain NASDAQ listing compliance. The company’s business mix has shifted sharply towards hardware sales for large enterprises, undercutting overall gross margins as software and SME tax services revenues contracted due to regulatory changes in China. HiTek’s competitive position relies on exclusive manufacturer relationships enabling competitively priced hardware offerings, primarily serving petrochemical sectors through embedded systems. Near-term growth is constrained by declining high-margin services and customer procurement variability, while the large cash buffer provides operational flexibility. Upcoming milestones include execution of hardware integration expansion and monitoring effects of electronic tax platform adoption on SME services.
Recent Operating Milestones: Capital Raise and Reverse Split
HiTek Global Inc.’s primary recent developments center on two significant corporate actions disclosed in its April 1, 2026 SEC Form 6-K filings [S2][S3]. First, it completed a registered direct offering that raised gross proceeds of approximately $3 million through the sale of 1.5 million Class A ordinary shares at $0.03 each and accompanying pre-funded warrants exercisable into up to an additional 98.5 million shares. The transaction included a placement agent fee of about eight percent total paid to Univest Securities. This capital infusion substantially expanded the company’s share count from roughly 27 million pre-offering shares to potentially over 126 million shares if full warrant exercise occurs, representing a notable dilution factor that balances urgent funding needs against shareholder value considerations.
Second, the company implemented an effective reverse stock split at a ratio of 50-for-1 as approved by shareholders in November 2025 and executed by board resolution in March 2026 [S3]. This reverse split adjusted the par value per share from $0.0001 to $0.005 and consolidated issued shares accordingly, maintaining HiTek's Nasdaq Capital Market listing under ticker "HKIT" but with new CUSIP G45139113 starting April 6, 2026. The strategic rationale includes meeting Nasdaq listing minimum bid price rules while streamlining the trading float post equity issuance.
Together, these moves mark transitional milestones reflecting management's intent to stabilize the company’s capital structure amid challenging operating realities.
Decoding HiTek Global’s Business Model and Product Lines
The latest annual report filed on April 24, 2026 [S1] clarifies HiTek Global’s bifurcated business model characterized by two main operating segments: (1) services targeting small and medium enterprises (SMEs), primarily involving tax-related services; and (2) services catered toward large enterprises encompassing hardware/equipment sales plus embedded system software sales.
The SME segment focuses on tax service offerings linked to VAT reporting compliance mandated across China-based businesses. However, since mid-2023 China’s Xiamen Taxation Bureau instituted free electronic invoice platforms replacing traditional systems—a seismic regulatory shift—which has materially impaired HiTek's fee-generating SME service revenue streams. Despite aggressive marketing alliances aimed at promoting proprietary electronic tax control platforms built with third-party cooperation, client uptake remains constrained by availability of free government alternatives.
On the other side, the company's large business segment offers two revenue sources: self-developed Communication Interface System (CIS) software designed to convert field data such as industrial metrics at petrochemical plants into analyzable formats; plus complementary computer networking hardware including routers, industrial switches, servers, internet firewalls, and safety monitoring equipment tailored predominantly for petrochemical enterprises.
Hardware sales have surged rapidly: they now comprise approximately 94% of total revenue as of fiscal year-end December 31, 2025 versus just 58% in prior year periods [S1]. Concurrently, software sales have shrunk dramatically to around only 2%, down from near one-third previously; SME tax service revenue similarly slipped to roughly four percent [S1]. This shift effectively dilutes average gross margin stacks given hardware's inherently lower margin profile relative to software licensing or subscription offerings which historically exceed fifty percent gross margins.
Industry Environment and Competitive Positioning
HiTek operates within specialized industrial communication markets interfacing closely with Chinese petrochemical industries—an environment demanding robust technology integration coupled with precise operational reliability.
Competitively, the company leverages exclusive partnerships with hardware manufacturers enabling it to source equipment at preferential costs—a definite moat enhancing price competitiveness despite limited scale advantages [S1]. Its embedded CIS platform serves niche analytics needs providing moderate switching costs but faces typical VIE arrangement risks because foreign investors hold contractual control rather than equity interest in operating Chinese entities.
VAT reforms enacted by Chinese authorities intensify sector challenges by mandating free e-invoice use that undermines proprietary tax service viability for SMEs—a critical pressure point for HiTek’s smaller client segment.
Additionally, supply chain resilience is vital given reliance on third-party industrial-grade hardware suppliers where disruptions could cascade into delayed deliveries or margin compression stemming from logistics cost inflation [S1][S16].
Growth Dynamics and Constraints: Navigating Revenue Mix Changes
HiTek’s historical trajectory shows cyclical headwinds compounded by structural factors reshaping its revenue bases. While total revenues soared by approximately 125% to $6.54 million in fiscal year ended December 31, 2025 compared with prior year [F1], this top-line growth belies deeper profitability pressures rooted in the pivot towards hardware products that command thinner margins [S5]. Gross profit plummeted from over one million dollars in prior years to around $690k representing a steep gross margin decline to just over ten percent from prior mid-thirties percentages [F1][S5].
Future growth levers appear tied largely to expanding advanced hardware integration system offerings targeted at commercial industrial clients—products such as enterprise-grade routers and security firewalls mentioned by management intentions—but penetration hinges on customer procurement appetite amidst broader market sluggishness [S1].
Meanwhile, SME segment constraints remain salient due to widespread adoption of free electronic invoice platforms significantly contracting fee-based services revenue pools despite proactive marketing efforts [S1]. Software segment outlook carries cautious optimism attributable to ongoing development of updated invoice software better aligned with enterprise demands combined with nascent contract negotiations yet tempered by recent customer procurement pullbacks [S7].
The concentrated customer base—with three major clients accounting for over three quarters of sales—amplifies exposure risk should any key customer reduce orders or delay payments substantially impacting cash flow stability [S16].
Corporate Governance, Regulatory Context, and Risks
HiTek functions as an offshore Cayman Islands holding entity controlling Chinese operations via variable interest entity agreements (VIEs) under US GAAP consolidation rules but without direct equity ownership—entailing legal enforcement uncertainties typical for foreign-listed China-based companies [S1]. The board enforces insider trading regulations alongside compensation clawback policies aligned with Nasdaq mandates [S1][S13].
Cybersecurity governance rests primarily on executive oversight without dedicated third-party auditing currently due to resource scale considerations; however, no material cybersecurity incidents have been reported recently indicating effective risk mitigation thus far [S1][S12].
Regulatory risks are pronounced given China's evolving VAT frameworks that have upended legacy tax service models alongside potential fluctuating interpretations of VIE contract enforceability affecting foreign investor protections. Additionally, incorporation within the Cayman Islands affords favorable tax treatment including exemption from income or capital gains taxes domestically but presents usual jurisdictional governance nuances [S1].
Key Upcoming Catalysts and Monitoring Points
Going forward, stakeholders should closely watch several execution metrics:
- Post-reverse split trading volume stability starting April Q2 quarter including spread tightening or volatility spikes affecting market liquidity.
- Utilization efficiency of newly raised capital funding for scaling hardware integrations or R&D activities surrounding enhanced CIS functionalities.
- Launch cadence and customer adoption rates for planned hardware solutions such as routers and industrial firewalls among large enterprise clients.
- Shifts in SME client retention or growth rates relative to competitive free e-invoice adoption trends influenced by regulatory adjustments or market responses.
- Quarterly operational disclosures detailing revenues by segment plus margin trend trajectories providing insight into progress toward restoring profitability.
- Any insider share disposition or secondary offering signals reflecting management confidence levels.
Timely updates here will shape assessments concerning both strategic pivot success and resilience amid external environmental pressures.
Financial Profile: Liquidity, Income Statement Trends, and Balance Sheet Snapshot
Historical performance (annual)
|
| FY | Rev ($mm) | Net ($) | CFO ($mm) | OpInc ($) | Rev YoY | Net YoY |
|---|---|---|---|---|---|---|
| 2025 | 7 | 180142 | -2 | -1791419 | +125.0% | +120.1% |
| 2024 | 3 | -896690 | -1 | -1747144 | -185.6% | |
| 2023 | 1047641 | 0 | 101061 | -26.0% | ||
| 2022 | 6 | 1415745 | 4 | 1627210 | -0.5% |
Source: SEC companyfacts cache [F1].
Capital returns and efficiency (annual)
|
| FY | FCF ($) | ROE% |
|---|---|---|
| 2025 | -1722348 | 0.5 |
| 2024 | -875037 | -2.5 |
| 2023 | -248411 | 3.7 |
| 2022 | 10.5 |
Source: SEC companyfacts cache [F1].
Summary financial metrics per company facts annual data ending December 31, 2025 illustrate salient trends confirming analysis above:
|
| FY | Revenue (USD) | Op Income (USD) | Net Income (USD) | CFO (USD) | Capex (USD) | Equity (USD) | Rev YoY % | Net YoY % |
|---|---|---|---|---|---|---|---|---|
| 2025 | $6.54M | -$1.79M | $180K | -$1.54M | $186K | $36M | +125% | +120% |
| 2024 | $2.90M | -$1.75M | -$897K | -$689K | $186K | $35M | -36% | -186% |
| 2023 | $4.56M | +$0.10M | $1.05M | -$62K | N/A | $28M | N/A | N/A |
Liquidity remains strong with current assets substantially exceeding current liabilities ($40.79M vs $4.95M) producing a current ratio well above eight times—an ample buffer against short-term obligations [F1][S12]. Cash reserves approximate $3.6 million while total debt is negligible based on latest available figures underscoring minimal leverage risk [F1].
Operating cash flows remain negative reflecting investment-heavy phases or working capital demands though capital raises including IPO proceeds ($16M raised in April 2023), private placements ($8+M raised during mid-2024), ATM programs early in Q1’26 alongside the recent direct $3M raise underpin cash runway projections extending beyond next twelve months barring unforeseen disruptions [F1][S18][S20].
Overall operating losses stem chiefly from compressed gross margins driven by unfavorable sales mix compounded by rising operating expenses though recent expense controls hint at improving cost discipline with general & administrative expenses reduced over prior year levels alongside modest selling expense increases focused on customer acquisition activities [F1][S21].
This analysis synthesizes disclosed SEC filings through April 24, 2026 without speculative assumptions beyond cited data sources. It aims solely for informational purposes without expressing investment recommendations or advice.
Disclaimer: This is research-only, informational analysis and not investment advice. It may include AI-generated interpretation and general industry context. Always verify important details using primary sources.
Comments