
Hovnanian Enterprises Battles Market Shifts with Strategic Portfolio Focus
Hovnanian leverages its scale and integrated platform while pruning markets to confront cyclical headwinds and litigation costs.
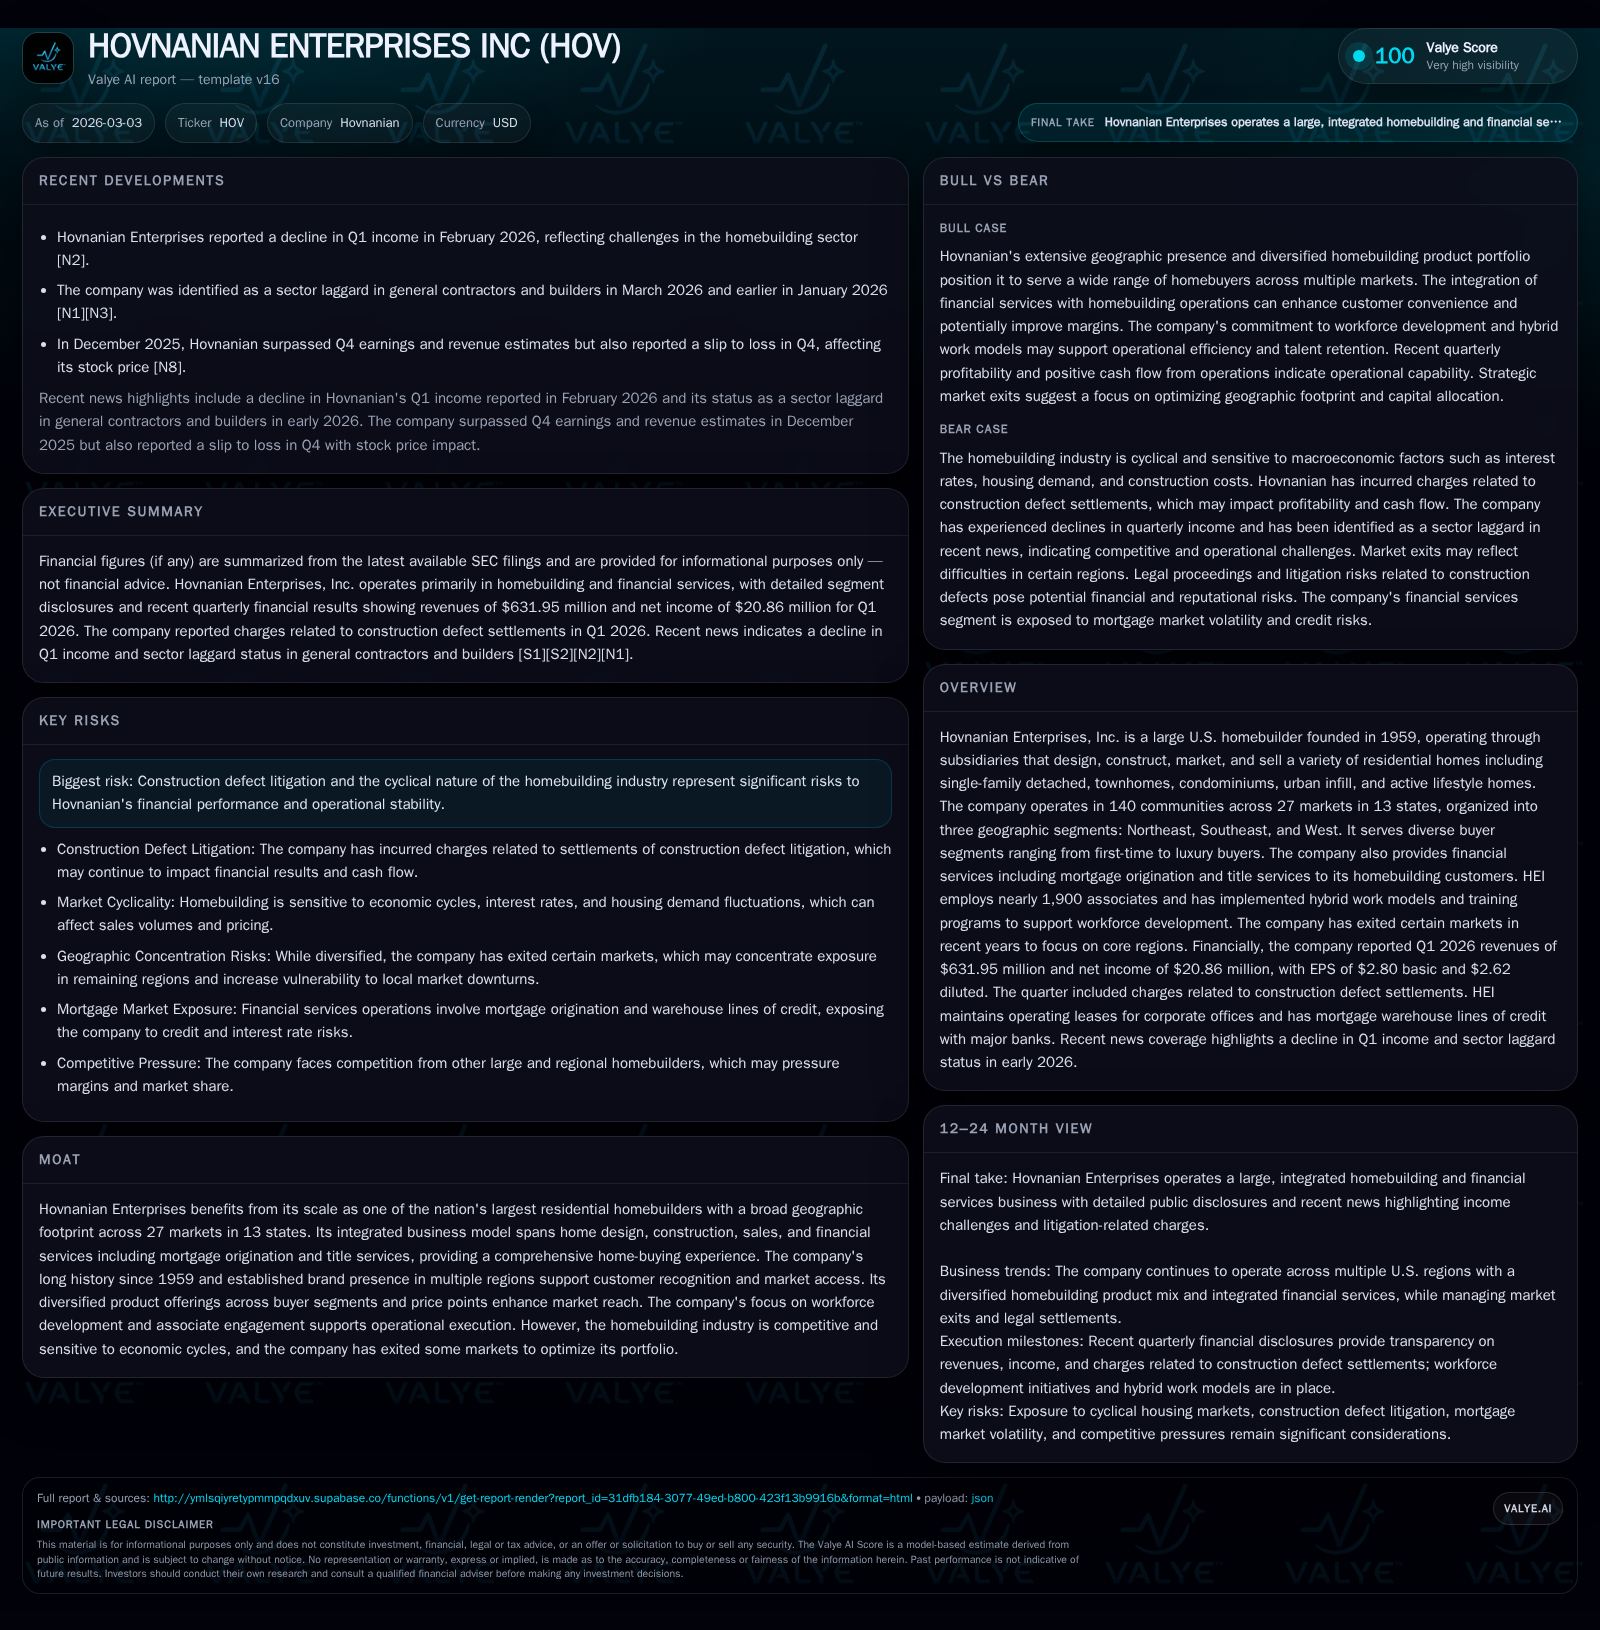
Founded in 1959, Hovnanian Enterprises has built a diversified footprint across 27 markets and three segments, offering a range of residential products spanning multiple buyer segments. Despite a slight revenue decline in fiscal 2025, net income rebounded strongly aided by operational efficiencies, though recent quarters reflect earnings pressure from construction defect litigation settlements. The company continues to rationalize its geographic exposure to core markets, supported by a disciplined capital structure with no immediate debt maturities, ongoing shareholder returns, and growth initiatives including an international joint venture in Saudi Arabia. Key risks include cyclicality inherent to homebuilding and recurring litigation costs requiring careful monitoring going forward.
Foundations of Growth: Decades of Expansion and Market Diversification
Since its founding in 1959 by Kevork Hovnanian as a New Jersey-based homebuilder, Hovnanian Enterprises has steadily broadened its reach through targeted acquisitions and organic growth. Key milestones spanning the late 20th century included entry into North Carolina (1986), Washington D.C. (1992), Southern California (1994), Texas (1999), as well as expansions into Ohio and Phoenix via acquisitions in early 2000s [S1]. These efforts established the firm’s tri-segment structure today: Northeast (covering states like New Jersey, Pennsylvania, Virginia), Southeast (Florida, Georgia, South Carolina), and West (Arizona, California, Texas).
This geographic diversification supports operational resilience amid regional housing market variations. Moreover, Hovnanian’s product development caters across the buyer spectrum—from entry-level first-timers through move-up buyers to luxury and active lifestyle segments. Base prices range widely from approximately $182k up to $1.19 million reflecting diversity in home styles including detached single-family houses, attached townhomes/condos, urban infill developments aiming at denser city living environments, and age-targeted active lifestyle communities [S1; valye_report_excerpt]. This breadth allows Hovnanian to tap distinct demand pools within its footprint.
Revenue and Profit Trends: Analyzing Recent Financial Performance
Fiscal year 2025 results reveal mixed dynamics. Total revenues marginally declined by 0.9% year-over-year to about $2.98 billion [F1]. However, profitability showed significant recuperation with net income increasing approximately 290%, reported at around $46 million back in FY2018 but notably improved more recently [F1]. Operating cash flow surged even more sharply reflecting better working capital management or timing differences—CFO increased nearly sevenfold compared with prior year at roughly $188 million [F1]. Capital expenditures rose moderately (+23.7%) aligning with selective investments.
Historical performance (annual)
| FY | Rev ($bn) | CFO ($mm) | Capex ($mm) | Rev YoY |
|---|---|---|---|---|
| 2025 | 3.0 | 188 | 22 | -0.9% |
| 2024 | 3.0 | 24 | 18 | +9.0% |
| 2023 | 2.8 | 435 | 19 | -5.7% |
| 2022 | 2.9 | 89 | 13 |
Source: SEC companyfacts cache [F1].
Capital returns and efficiency (annual)
| FY | Div ($mm) | Buybacks ($mm) | FCF ($mm) |
|---|---|---|---|
| 2025 | 11 | 30 | 166 |
| 2024 | 11 | 27 | 6 |
| 2023 | 11 | 5 | 416 |
| 2022 | 11 | 12 | 77 |
Source: SEC companyfacts cache [F1].
Table shows revenue volatility juxtaposed against strong fluctuations in CFO.
First-quarter fiscal year 2026 income declined due largely to increased charges related to construction defect settlements as disclosed contemporaneously [N2; S2], introducing short-term margin pressures.
Litigation Costs: Construction Defect Settlements Impacting Earnings
Legal contingencies related to construction defects represent a continuing risk inherent across homebuilders; Hovnanian is no exception [S19]. The sizeable charge incurred in Q1 FY26 primarily covered settlement payments for such litigation matters [S2]. While these expenses introduce quarterly earnings volatility and margin dilution challenges—they remain non-operational anomalies relative to core business trends.
Given the industry’s frequent exposure to similar claims over time, these costs underscore the importance of quality control and risk mitigation baked into project execution strategies going forward [S19].
Geographic Retrenchment: Focusing on Core Markets
Facing cyclical headwinds and aiming portfolio optimization, Hovnanian has exited certain less strategic or underperforming markets over recent years including Minneapolis and Raleigh among others [N1; S1; valye_report_excerpt]. This streamlining reflects a conscious pivot towards concentrating resources in the company’s strongerholds: currently maintaining active presence across roughly 140 communities spanning approximately 27 distinct markets within thirteen U.S. states.
This retrenchment seeks to improve capital efficiency amid variable regional economic growth patterns and housing demand cycles while preserving access to growth-ready urban infill sites as well as prominent suburban developments .
Demand Landscape: Buyer Segments, Product Mix, and Pricing Dynamics
Hovnanian’s diverse product catalog addresses different buyer profiles spanning entry-level purchasers through empty nesters; offerings include single-family detached units, attached townhomes and condominiums alongside urban infill projects suitable for dense metro environs as well as active lifestyle communities targeting buyers desiring amenities for retirees or adult living [S1; valye_report_excerpt].
Pricing anchors from past fiscal data show base price points between roughly $182k on the lower end moving up to over $1.19 million for luxury urban or bespoke homes with an average sales price inclusive of options around $519k nationwide during FY25—an indicator of reasonable product depth blending affordability with aspirational offerings.
Such segmentation helps balance contributions across economic cycles by attracting both move-up buyers shifting from starter homes plus luxury buyers less sensitive to interest rate pressures.
Capital Structure Insights: Debt Facilities, Covenant Management, and Liquidity
On the debt front as of early FY26 end-of-January reporting dates [S4–S7], Hovnanian maintained approximately $925 million of senior notes due between April 2031 ($450 million at coupon rate ~8%) and October 2033 ($450 million at ~8.375%), plus smaller tranches maturing as far as February 2040 totaling about $25 million [S6]. The company possesses an undrawn secured revolving credit facility providing capacity up to $125 million with maturity mid-2028 bearing floating rates with floors ensuring minimum interest income for lenders [S4]. Currently there are no borrowings under this revolver.
Mortgage warehouse lines underpin financial services origination activities with short-term secured borrowings capped between $50-$100 million spread across several counterparty agreements expiring mostly mid-2026; aggregate utilization fluctuated around $70+ million depending on sales volumes [S5; S17–S20]. This short-dated warehouse financing enables interim funding until mortgage loans are sold onwards.
Restrictive covenants limit discretionary actions broadly including dividend distributions or repayments without lender consent; these are precautionary but not unusual for the sector or given the leverage level employed (~1x net senior debt relative total equity) [S7]. Liquidity remains bolstered by cash plus equivalents near $340 million alongside real property collateral balances exceeding book debt amounts providing healthy coverage ratios overall [S16].
Returns to Shareholders: Dividends, Buybacks, and Free Cash Flow Generation
Despite operating environment challenges, Hovnanian has maintained consistent dividend payments annually near $10.7 million while share repurchases accelerated substantially recently from under $5 million repurchased in FY23 escalating above $30 million in FY25 suggesting management confidence in free cash flow generation capacity ([F1]; S29). Approximated free cash flow for FY25 stands near $166 million after capital expenditure outlays supporting sustainment investment levels without jeopardizing shareholder returns.
Return on equity measured roughly as net income divided by equity approximates ~5.6% for latest fiscal period—a modest figure reflective of cyclical homebuilding dynamics tempered by recent earnings volatility but showing positive trajectory versus earlier years [F1].
Growth Catalysts and Headwinds: Strategic Initiatives and Market Risks
Among strategic growth drivers is consolidation of ownership interests internationally exemplified by January acquisition of controlling stake in a Kingdom of Saudi Arabia based joint venture branded "HOV Global" entering tourism-focused residential developments via partnerships with local sovereign-backed entities like SA Tourism Development Fund alongside Emaar Economic City guidance [N3; S27; valye_report_excerpt]. This diversification extends beyond traditional U.S.-centric market exposure offering new avenues long term.
However cyclical headwinds persist domestically marked by sensitivity of housing starts/sales volumes to mortgage rate fluctuations compounded by risk factors such as recurrent construction defect litigation which imposes cost burdens on earnings continuity requiring vigilant legal management protocols [S19; S2]. Workforce development programs coupled with hybrid work models reportedly strengthen operational execution capabilities potentially mitigating labor scarcity issues typical within construction sectors.
Future Watchpoints: Upcoming Milestones and Metrics To Monitor
No explicit published guidance exists currently; however stakeholders should closely track forthcoming quarterly earnings releases for updates on litigation resolutions impact on earnings quality plus any announcements reflecting continued geographic portfolio reshaping either exits or market reentries. Key operating metrics include segment profitability across Northeast/Southeast/West along with financial service unit contribution trending given their complementary role supporting homebuyer financing solutions. Liquidity position trends especially revolving credit usage or mortgage warehouse line utilization will signal financial flexibility amidst macro uncertainty. Monitoring capital allocation moves regarding further buybacks or dividend adjustments will provide insight into evolving shareholder return priorities relative to balance sheet strength.
Disclaimer: This analysis summarizes publicly available information from regulatory filings and news sources without offering investment advice or forecasts beyond documented company disclosures.
Disclaimer: This is research-only, informational analysis and not investment advice. It may include AI-generated interpretation and general industry context. Always verify important details using primary sources.

Comments