
HealthEquity Expands Market Lead Through Integrated Platforms and Network Growth
The latest quarterly update highlights HealthEquity’s sustained growth in health savings accounts backed by its integrated technology platform and expansive distribution network, despite leverage-related financial constraints.
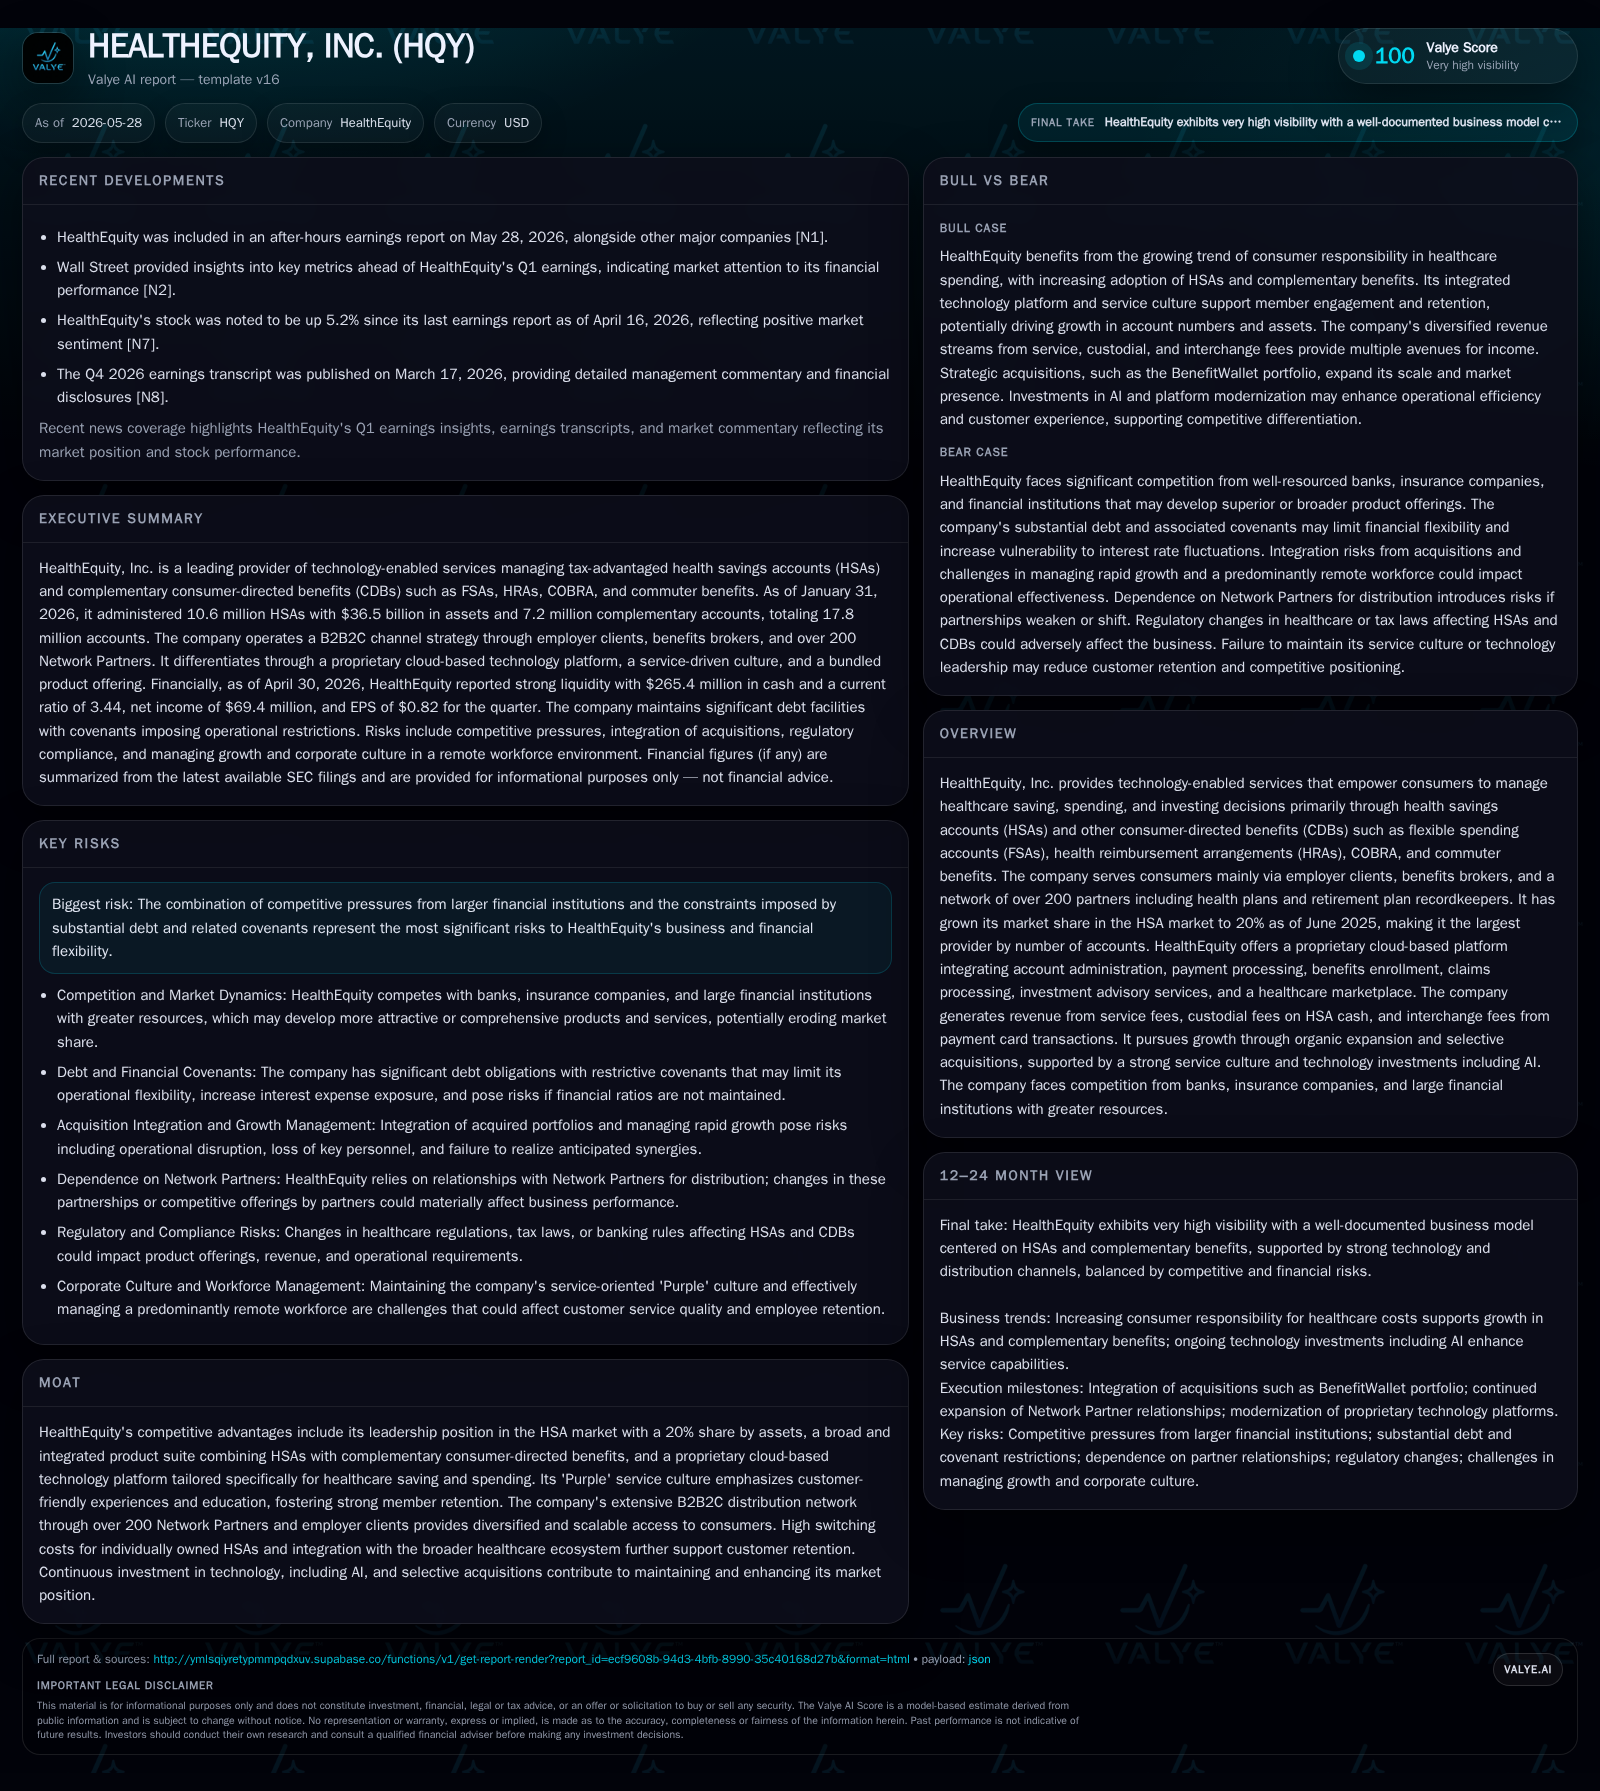
HealthEquity’s May 2026 quarterly filing confirms continued momentum in account growth and engagement driven by its proprietary cloud-based platform that integrates HSAs with complementary consumer-directed benefits. The company leverages a large B2B2C distribution network of over 200 partners to expand market share, now at 20% of HSA assets. However, substantial debt and covenant restrictions impose financial risks that may temper capital allocation flexibility. Watch for metrics like net new money inflows and AI-driven efficiency gains as key early indicators of sustained competitiveness.
Latest Quarterly Operating Developments
In its May 28, 2026 Form 10-Q [S2], HealthEquity provided a consistent update reinforcing its leadership in the health savings account (HSA) market. The company reported administering approximately 10.6 million HSAs with total HSA assets reaching $36.5 billion as of January 31, 2026 [S17], maintaining its position as the largest provider by number of accounts according to the June 2025 Devenir report [S1]. Total accounts including complementary consumer-directed benefits (CDBs) such as FSAs and HRAs approached 17.8 million. The filing confirms ongoing progress integrating more than 200 network partners to enhance B2B2C distribution reach.
Management commentary noted sustained usage and engagement driven by enhancements to their proprietary cloud platform incorporating AI-enabled process automation tools aimed at improving member experience while reducing costs [S1]. A recent 8-K filing [S3] attached a press release underscoring stable member acquisition velocity and continued adoption of the company’s Enhanced Rates cash placement program through insurance partners—a scheme that contributes positively to custodial revenue through higher yield contracts [S14]. No material changes in risk factors were reported [S2].
Business Model and Product Integration
At the core of HealthEquity’s business is a technologically advanced ecosystem powering tax-advantaged healthcare saving and spending accounts. Its proprietary cloud-based platform delivers integrated services: custodial administration of HSAs and other CDBs; electronic fund transfers; benefits enrollment; claims adjudication interfaces; medical bill payment utilities; investment advisory through SEC-registered automated solutions; plus an online healthcare marketplace facilitating medical expense optimization [S1][S7][S11][S14]
HSAs serve as individually owned trust accounts offering "triple tax savings": deductible contributions, tax-free investment growth, and tax-free qualified medical distributions [S19]. This structure confers high switching costs given ownership continuity across employment changes, which supports customer retention. The company's Purple service culture emphasizes personalized consumer support and education delivered via multiple channels including real-time specialists accessible around the clock [S11].
Complementary CDBs—FSAs, HRAs, COBRA administration, commuter benefits—are bundled to broaden value for employer clients and benefits brokers. This integrated product suite helps HealthEquity deepen engagement within the healthcare benefits ecosystem while offering clients single-solution convenience [S7][S23]. Increased use of APIs enables tailored partner integrations rather than forcing uniform data models, maximizing ecosystem connectivity [S21].
Industry Structure and Competitive Positioning
HealthEquity holds approximately a 20% share of the expanding HSA market measured by assets under management as of June 2025 [S1][S20]. While it is second largest by asset size behind mutual fund companies like Fidelity Investments known for broader retirement product expertise, HealthEquity leads by number of individual accounts—a significant advantage considering switching frictions in this space.
Competitors range from large diversified banks with deeper capital resources, insurance companies with bundled benefit offerings, to grocery chains or payroll providers offering point solutions but lacking integrated custody or investment capabilities [S20][S29]. HealthEquity’s moat stems from its vertically integrated technology stack designed specifically for healthcare spending decisions coupled with extensive B2B2C distribution via over 200 Network Partners comprising health plans, benefit administrators, brokers, retirement plan recordkeepers, and direct employer clients [S17].
Pricing power derives from recurring service fees paid by employers (Clients), brokers (Network Partners), and members (account holders), covering administrative services plus interchange fees on payment card transactions [S15]. Custodial revenue accrues from cash deposits placed with insurance company partners earning enhanced yields under group annuity arrangements (Enhanced Rates) or federally insured banks (Basic Rates) [S14]. This mix offers margin expansion opportunities as balances grow without proportional cost increases due to scalable technology.
Customer Ecosystem and Distribution Network
HealthEquity leverages a complex B2B2C channel strategy emphasizing partner-driven access combined with direct client sales support. Network Partners employ thousands of sales reps who cross-promote HDHP plans alongside HealthEquity products while employer HR professionals explain account advantages directly to employees [S7][S17][S23]. Extensive integration into partner ecosystems through configurable APIs supports custom branding, sales incentives alignment, single sign-on experiences, wellness tools integration, and flexible fee structures [S21].
Growth Opportunities and Investment Focus
The company’s growth thesis principally rides structural trends favoring increasing individual responsibility for healthcare spending via tax-advantaged vehicles. Rising deductibles under HDHPs naturally feed demand for HSAs—a dynamic HealthEquity captures by expanding its addressable market [S17][N8]. Cross-selling complementary CDBs widens wallet share per client while investments in AI-powered automation tools reduce operational costs enhancing margins [S11][N14].
Selective acquisitions supplement organic expansion; recent purchases include BenefitWallet's HSA portfolio adding approximately $2.7 billion in assets acquired through credit facility borrowings evidencing a deliberate consolidation strategy within fragmented administration sub-segments [S19][N8]. Innovations such as chip-enabled stacked cards enable simultaneous use of multiple accounts improving user convenience—a differentiator helpful to member retention.
The company states AI initiatives focus on improved claims handling efficiency (Expedited Claims), enhanced customer support bots (HSAnswers), improved data analytics for personalized research views, electronic communication adoption replacing paper processes, and greater self-service capabilities in digital portals [S21].
Risks from Competitive and Leverage Pressures
Despite operational strengths, HealthEquity carries material financial risks related to its capital structure. As of April 30, 2026, total debt stood near $947 million against cash reserves around $265 million yielding net debt approximately $682 million alongside a current ratio approximating 3.44 indicating adequate short-term liquidity but heightened leverage obligations [F1]. These liabilities include a $1 billion senior secured revolving credit facility maturing in mid-2029 with $361.9 million drawn at year-end plus $600 million in unsecured senior notes at fixed rates due in 2029 subject to restrictive covenants constraining debt levels and requiring maintenance of specified leverage ratios [S4][S5][S6].
Debt service absorbs meaningful portions of cash flow limiting ability to prioritize growth investments or acquisitions without generating incremental leverage risk. Variable rate borrowings expose interest expense sensitivity to rate hikes.
On the regulatory front, HealthEquity operates amid evolving healthcare laws affecting HSA eligibility criteria or federal/state tax incentives critical to product attractiveness [S16][S22][S24]. Any adverse change diminishing triple tax savings would materially impair demand fundamentals.
Operational risks include reliance on third-party insurance company partners holding HSA cash in Enhanced Rates programs which lack federal deposit insurance thus exposing members' funds in event of partner failure with potential reputational consequences for HealthEquity [S1][S16]. Cybersecurity compliance across platforms must continually evolve against escalating threats given sensitive personal health information managed.
Competitive pressures persist notably from larger financial institutions able to subsidize acquisition or marketing costs beyond HealthEquity's scale plus emerging fintech entrants deploying novel digital engagement models possibly eroding market position if unaddressed [S20][S29].
Forward-Looking Indicators and What to Monitor Next
Investors following HealthEquity should prioritize metrics signaling sustained account growth velocity alongside net new money inflows reflecting both organic client expansion plus retention levels post open enrollment seasons [N2][S2]. Monitoring active deployment outcomes for AI-powered efficiencies measured via cost-to-serve reductions or improved processing times will illuminate path toward margin improvement.
Legislative developments concerning healthcare taxation or eligibility rules for HSAs/CDBs remain key external variables influencing medium-term demand trajectory necessitating ongoing vigilance.
Summary of Financial Position and Capital Structure
HealthEquity ended April 2026 with cash & equivalents approximating $265 million balanced against total debt near $947 million yielding net debt about $682 million alongside a healthy current ratio near 3.44 reflecting sound short-term liquidity reserves sufficient relative to current liabilities around $136 million but underscoring significant longer-term leverage commitments warranting scrutiny amid rising interest rate environments or economic downturn risks [F1].[S4]
The senior secured revolving credit facility allows up to $1 billion with maturity in August 2029 but currently has a substantial outstanding balance limiting immediate borrowing capacity for expansions without deleveraging efforts. Interest expenses tied partly to variable rate borrowings could increase with macroeconomic tightening affecting free cash flow available for reinvestment or shareholder returns [S5][S6].[F1]
Overall financial discipline balancing growth ambitions versus servicing debt obligations will remain crucial as competitive dynamics evolve.
Disclaimer: This analysis is based solely on publicly filed SEC documents dated through May 28, 2026, company disclosures referenced therein, and related news reports without insider information or forecasts beyond available evidence presented.
Disclaimer: This is research-only, informational analysis and not investment advice. It may include AI-generated interpretation and general industry context. Always verify important details using primary sources.

Comments