
Titan Machinery Leverages Multi-Regional Footprint Amid Market Volatility
Titan Machinery’s latest quarterly results reveal revenue resilience overshadowed by persistent profitability and liquidity strains in a cyclical equipment market.
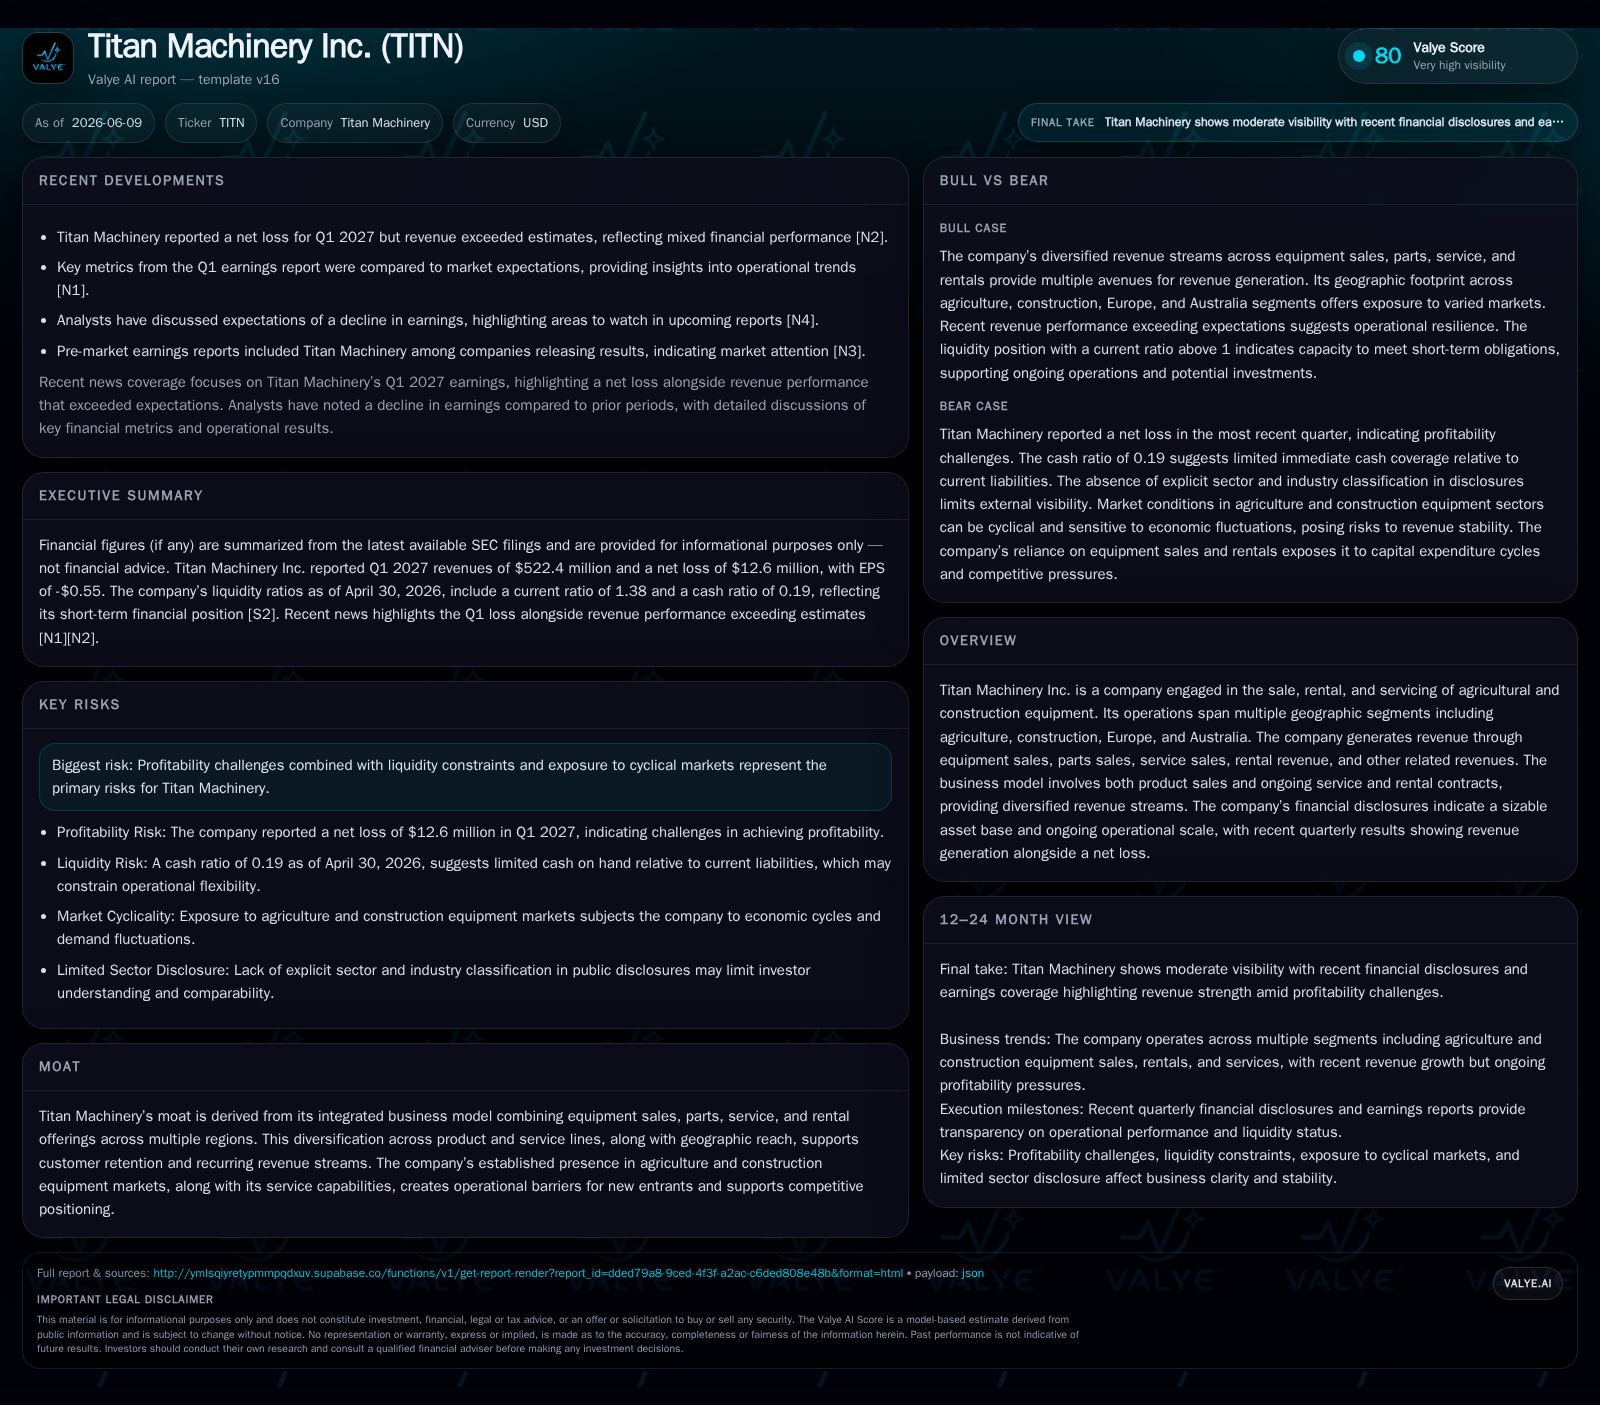
In its Q1 fiscal 2027 10-Q filing, Titan Machinery posted revenue above street estimates driven by robust new equipment sales across agriculture and construction sectors. However, the company reported ongoing net losses reflecting margin compression tied to elevated inventory carrying costs and service expense pressures. Titan’s integrated business model spans sales, parts, service, and rental offerings across the U.S., Europe, and Australia, supporting recurring revenue streams but exposing it to cyclical demand shifts and liquidity management challenges. Growth will depend on geographic expansion, service innovation—especially in precision farming—and operational efficiency improvements amid macroeconomic uncertainty.
Q1 Operating Update Highlights Revenue Strength but Margin Pressures Persist
Titan Machinery’s first quarter fiscal 2027 report filed June 9, 2026 (10-Q) showed a top-line performance exceeding analyst estimates primarily fueled by strong new equipment sales across its agricultural, construction, European, and Australian segments [S2][N2]. Despite this revenue strength, the company recorded another net loss period attributed to persistent profitability pressures largely stemming from elevated costs tied to inventory carrying and service operations. The report underscores the tension Titan faces balancing scale-driven revenue opportunity with the margin compression characteristic of its capital-intensive industry during market cyclicality.
Revenue outperformance reflected robust dealer activity responding to seasonal demand particularly in productive U.S. farming regions. However, amplified floorplan financing costs coupled with slower-than-expected inventory turnover weighed on operating margins, with floorplan turnover velocity—a key equipment dealer KPI—remaining under pressure [S2]. Analyst previews ahead of the release had signaled expectations for earnings decline versus prior quarters due to these factors [N4]. Thus, while volume metrics are encouraging for top-line growth continuity, operational cost control remains an acute challenge.
Integrated Business Model: Equipment Sales Complemented by Parts, Service, and Rental Revenue Streams
Titan's business model revolves around four major revenue verticals: new and used equipment sales (principally CNH Industrial products), a parts aftermarket that benefits from high retention customer bases, service sales facilitated by comprehensive technician deployment including mobile service trucks, and rental revenues from its fleet equipment [S1][S7]. This diversified approach creates multiple touchpoints with customers enhancing retention via preventative maintenance contracts supported by trained technicians scheduling on short notice without sacrificing utilization rates, a critical KPI in technician productivity.
Centralized inventory management paired with a broad footprint allows Titan to balance product availability against costly carrying expenses inherent in floorplan financing arrangements—a common industry dynamic where dealers finance extensive inventories through manufacturer-designated lenders such as CNH’s Capital arm [S9]. This capital-intensive floorplan financing requires careful management of inventory turnover velocity to avoid margin erosion. Specialized product application experts provide value-added pre-sale consultation as well as precision farming technology support, differentiating Titan from smaller competitors lacking scale or technical breadth.
This integrated model fosters recurring revenue durability beyond seasonal sales spikes by embedding Titan deeply into customers’ operational ecosystems through service contract renewals—a critical metric aligned to sector KPIs such as technician billable hours efficiency and parts turnover velocity, which directly impact aftermarket profitability and cash flow stability.
Industry Overview: Dealer Networks Face Cyclical Demand Across Ag & Construction Markets
Within the agricultural and construction equipment dealership industry, cyclicality is pronounced due to seasonally driven farm equipment purchasing tied to crop cycles and broader macroeconomic influences such as commodity price volatility. Infrastructure project funding variability further impacts construction equipment demand in Titan’s segments [S7]. These cyclical swings affect key operating metrics including equipment sales volume, parts turnover, and technician utilization rates.
Authorized dealer status with OEMs like CNH Industrial represents a competitive barrier limiting direct manufacturer penetration into these channels; securing franchise consents is also pivotal for acquisitions expanding geographic reach. Peers such as RDO Equipment Co. and Brandt Holdings represent regional scale competitors, but few match Titan’s diversified international footprint combining U.S., European, Australian presence along with emerging Eastern European markets like Ukraine [S27][S21]. This multi-regional presence helps mitigate localized demand volatility but introduces complexity in inventory and technician resource allocation.
Inventory floorplanning requirements necessitate significant capital commitments often financed through syndicate bank agreements underpinning working capital needs typical for companies operating this asset-heavy distribution model [S9]. These constraints exacerbate vulnerability during downturn periods where inventory turnover decelerates yet carrying costs persist, pressuring margins and liquidity.
Growth Enablers From Geographic Expansion to Service Innovations in Precision Agriculture
Titan continues pursuing strategic acquisitions to consolidate dealership operations within existing markets while entering new territories—most notably establishing or expanding operations in Ukraine alongside existing stores scattered across four European countries and three Australian states [S1][S21]. These moves aim to leverage localized agricultural productivity improvements as well as tap into underserved rural markets where OEM direct presence is limited.
On the innovation front, Titan invests in precision farming technologies coupled with farm data management offerings that address modern agricultural operators' needs for higher operational efficiency. This aligns with rising adoption trends for digital agronomy tools providing incremental revenue outside straightforward equipment sales while reinforcing customer stickiness through ongoing support contracts [S8]. These precision agriculture services contribute to higher technician billable hours and recurring service revenue, key KPIs for sustainable margin improvement.
Increasing rental fleet size combined with enhanced utilization rates also serves as a supplementary growth vector enabling customers flexible access without upfront purchase—critical during periods of capital expenditure caution among farmer or construction clients. Rental fleet utilization rate is a vital KPI reflecting asset productivity and revenue maximization in this segment.
Risks to Watch: Profitability Constraints, Inventory Management Costs, and Cyclicality Exposure
Despite solid revenue generation (~$2.43 billion FY run rate) [F1], Titan’s operating results remain under pressure reflected in an operating loss near $6.7 million and net losses approximately $54 million for the year ended January 31, 2026 [F1], underscoring ongoing structural profitability challenges in managing extensive working capital employed in inventory accumulation necessary for competitive stock availability.
Cyclicality inherent in agri-equipment purchases linked directly to commodity market health—and infrastructure construction spending variability—poses fundamental risk exposure that can cause uneven sales cadence or delayed order fulfillment responsiveness affecting margins acutely during downturns [S2][S7]. Elevated inventory carrying costs, including floorplan interest and depreciation, combined with labor-intensive service models, compress margins especially when technician utilization rates dip below optimal levels.
What’s Next: Monitoring Guidance, Expansion Milestones, and Operational Efficiency Gains
Looking forward, tracking guidance updates from upcoming quarterly reports will be essential for assessing progress on profitability improvement measures alongside margin stabilization plans articulated by management [S2][N4]. Expansion activities via acquisitions remain a core component of growth strategy targeting dealership density enhancement particularly in international markets promising stronger medium-term returns.
Operational attention will center on maximizing technician utilization rates—ensuring field workers spend a higher proportion of time on billable customer jobs—and improving inventory turnover ratios through more agile stocking policies responsive to demand signals without undermining availability or customer satisfaction [S2]. Success in renewing service contracts consistently will serve as a bellwether of customer retention strength driving aftermarket stability.
Financial Profile: Key Metrics Reflect Net Loss Despite Solid Top-Line Performance
Cash equivalents stood around $146 million historically; total consolidated debt is approximately $177 million with net debt near $30 million as of April 30, 2026 [F1]. The current ratio is about 1.38x for the same period [F1]. These metrics indicate moderate liquidity and leverage levels consistent with the capital-intensive nature of the equipment dealership business.
While top-line resilience provides foundation for future margin gains through executional improvements in service efficiency and rental utilization, longstanding profitability constraints underscore sector cyclicality realities combined with cost-heavy distribution models typical for this industry niche.
This analysis uses the most recent SEC filings including the Q1 10-Q dated June 9, 2026 ([S2]) alongside supplemental annual 10-K disclosures ([S1],[S7]) providing foundational business context. Financial data references come from companyfacts ([F1]). No investment advice or research views are intended or implied herein.
Financial position in context
As of 2026-04-30, companyfacts shows $177mm of total debt [F1]. Companyfacts also indicates net debt of roughly $30mm for the latest available period [F1]. Current assets of $1,085mm and current liabilities of $788mm imply a current ratio near 1.38x for 2026-04-30 [F1].
Disclaimer: This is research-only, informational analysis and not investment advice. It may include AI-generated interpretation and general industry context. Always verify important details using primary sources.
Comments