
High Templar Tech's Profit Surge Clouds Revenue Setback and Investment Patterns
HTT’s 2025 results reveal a stark divergence between soaring net income and sharply reduced revenue and capital spending.
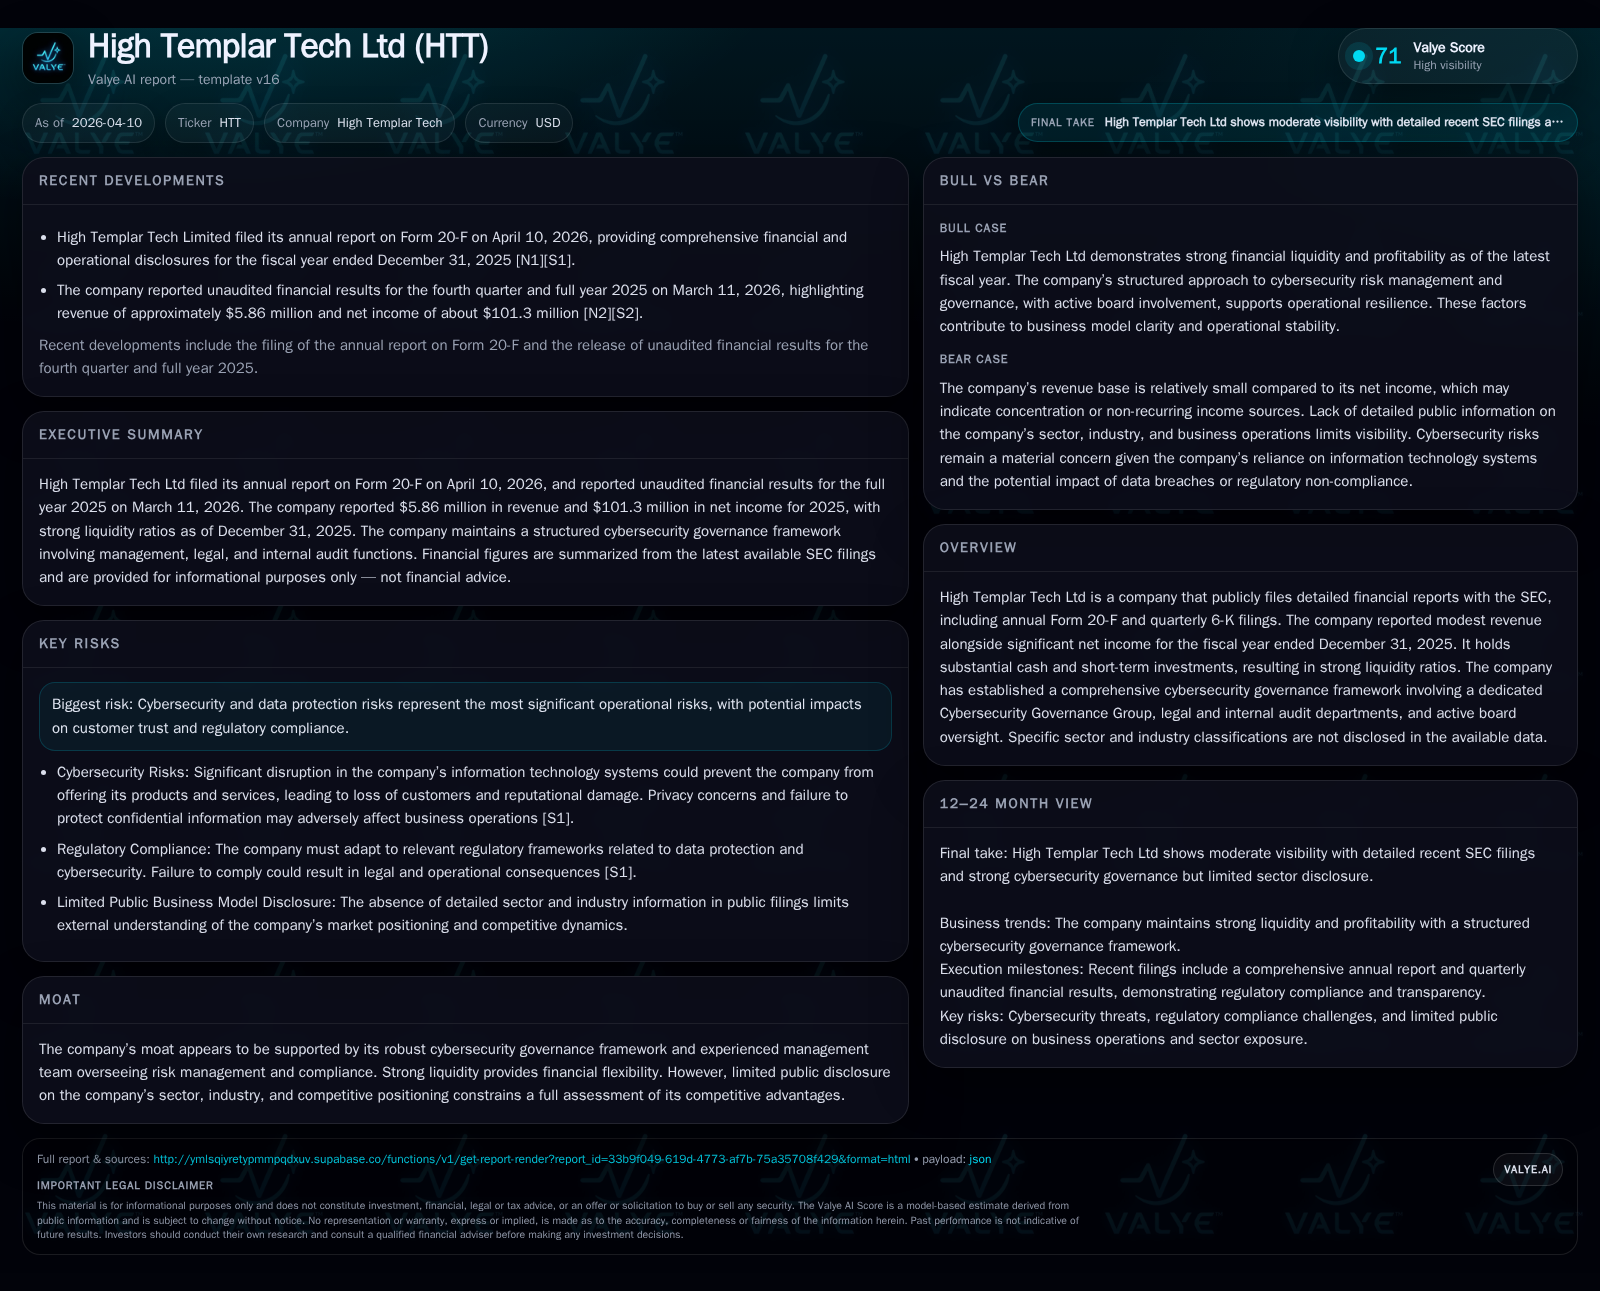
High Templar Tech Ltd delivered a remarkable rebound in net income for fiscal 2025, posting $101 million, a more than sevenfold increase from the prior year despite an 80% plunge in revenues to just $5.9 million. This profit surge contrasts with continued operating losses and a strategic pullback on capital expenditures, which declined nearly 62% year-over-year. Strong liquidity with cash surpassing $790 million underpins financial flexibility as the company navigates sector-related uncertainties and intensifies its cybersecurity governance. The firm sustains shareholder value through sizable share repurchase programs while mitigating risks centered on data protection and capital availability.
Financial Performance Trends: Decoupling of Revenues and Profitability
High Templar Tech Ltd (HTT) exhibited an unusual financial profile in fiscal year 2025 marked by severe revenue contraction paired with a strong net income rebound. Annual revenue plummeted to approximately $5.86 million in 2025 from $29.65 million the prior year, representing an 80.2% decline [F1]. Despite this setback at the top line, net income soared to $101.3 million—over seven times the prior year’s reported profit of $12.6 million—resulting in a strikingly positive bottom line juxtaposed against ongoing operating losses.
Operating income remained firmly negative at -$57.0 million in 2025 but showed slight improvement compared with previous years’ deeper losses exceeding -$42 million in 2024 [F1]. This pattern indicates greater profit contribution from non-operating activities offsetting core operating challenges.
Historical performance (annual)
| FY | Rev ($mm) | Net ($mm) | CFO ($mm) | OpInc ($mm) | Rev YoY | Net YoY |
|---|---|---|---|---|---|---|
| 2025 | 6 | 101 | 98 | -57 | -80.2% | +706.3% |
| 2024 | 30 | 13 | -15 | -42 | +66.6% | +128.0% |
| 2023 | 18 | 6 | 50 | -47 | -78.7% | +110.5% |
| 2022 | 84 | -52 | 38 | -48 |
Source: SEC companyfacts cache [F1].
Capital returns and efficiency (annual)
| FY | Buybacks ($mm) | FCF ($mm) | ROE% |
|---|---|---|---|
| 2025 | 43 | 82 | 6.1 |
| 2024 | 73 | -59 | 0.8 |
| 2023 | 59 | -30 | 0.3 |
| 2022 | 21 | -2 | -3.0 |
Source: SEC companyfacts cache [F1].
Table: High Templar Tech Ltd Historical Financial Highlights (2022-2025) [F1]
Drivers Behind the Net Income Resurgence in 2025
The substantial net income turnaround in fiscal year 2025 is attributable primarily to significant non-operating income sources despite core operating losses remaining entrenched [S1][F1]. The company disclosed investment income from derivative instruments amounting to approximately RMB188.7 million (circa US$28 million), along with unrealized investment gains on short-term investments and structured deposits totaling RMB66.9 million (~US$10 million). Impairment losses related to other assets at RMB54.3 million partially offset these gains but the net effect remains materially positive.
These non-operating inflows significantly masked underlying operational profitability challenges as HTT continues to navigate structural pressures limiting top-line expansion.
Operating Cash Flows and Capital Expenditures: Shifts in Investment Dynamics
A pronounced recovery in cash flows from operations mirrored the profit rebound; operating cash flow rose by approximately 746%, reaching $98.2 million USD in FY25 from a negative cash flow of -$15 million in FY24 [F1][S4][S5]. This surge was fueled by realized profits coupled with effective working capital management.
Simultaneously, HTT sharply curtailed capital expenditures from $43.6 million down to nearly $16.7 million—a reduction of nearly two-thirds year-over-year [F1][S8]. Capital spending focused predominantly on facility construction, equipment purchase, intangible assets, and leasehold improvements geared towards sustaining existing business platforms rather than aggressive expansion.
The resulting free cash flow approximated $81.6 million USD for FY25, underscoring prudent liquidity management amid uncertain revenue growth prospects.
Cybersecurity Governance as a Strategic Moat Amidst Uncertainties
Though HTT’s sector specifics remain undisclosed publicly, it has articulated cyber risk mitigation as pivotal to its business continuity and competitive positioning [S1]. The company operates a dedicated Cybersecurity Governance Group that interfaces regularly with senior management to oversee risk identification, mitigation protocols, incident detection, and remediation efforts.
Led by experienced professionals with extensive backgrounds spanning cybersecurity frameworks establishment (Mr. Fu), legal interpretation of regulatory mandates (Mr. Yang), and internal audits aligned with IT controls (Mr.Jiang), this multi-disciplinary approach ensures rigorous defense against cyber threats [S1][S18]. The framework mandates preventive policies such as background screening during recruitment, employee confidentiality agreements aligned with operational security requirements, and consistent compliance reviews.
This robust governance infrastructure forms a barrier against operational disruptions that could erode customer trust or invite regulatory penalties—a material moat given intensified global cybersecurity imperatives.
Liquidity and Capital Structure Supporting Flexibility
HTT retains formidable liquidity buffers underpinning operational resilience [F1][S4][S5]. At fiscal year-end December 31, 2025, the company held cash and cash equivalents totaling approximately $791 million USD alongside current assets of about $1.63 billion versus current liabilities near $283 million—yielding a strong current ratio around 5.75x.
Prudent debt management reduces refinancing pressures though the necessity for future capital infusion remains an acknowledged risk should unexpected business opportunities or contingencies arise [S4]. The firm’s ability to maneuver working capital components remains critical for sustaining financial strength through varying market cycles.
Shareholder Returns: Analyzing Recent Buyback Programs and Dividend Policy
Capital allocation reflects a strong bias toward enhancing shareholder value via share repurchases rather than dividend payouts [S3][S10][F1]. HTT has consistently executed ADS buybacks across successive programs:
- A completed $500M repurchase initiated in January 2020,
- A concluded $200M program launched June 2022,
- And an active $300M plan commenced mid-2024 expected to run through June 2027.
In fiscal year 2025 alone, buybacks amounted to approximately $43 million USD as part of this ongoing commitment [F1][S15]. Dividends remain unissued since inception owing to reinvestment priorities and regulatory constraints tied to subsidiaries’ retained earnings distributions under PRC law [S10][S11].
The relative absence of dividends alongside measured buybacks indicates cautious capital stewardship emphasizing liquidity preservation while providing some support for share price stability amidst episodic earnings volatility.
Risk Factors Focused on Cybersecurity and Capital Availability
Operational risks heavily center on cybersecurity vulnerabilities that could trigger service interruptions or compromise confidential data—potentially damaging brand reputation and inviting regulatory scrutiny [S9][S16]. The company highlights scenarios such as external system disruptions beyond control which may reduce product attractiveness leading to customer attrition.
Additionally, dependence on timely access to capital markets or alternative financing sources poses constraints if market conditions deteriorate or terms become unfavorable [S4]. Effective working capital management is thus critical but cannot fully obviate macroeconomic or sector-specific shocks affecting funding availability.
Outlook: Assessing Growth Prospects Against Operational Constraints
Explicit forward-looking guidance remains absent from recent filings or press releases [N1][N2]; hence projections require cautious analytical framing based on observable data trajectories.
Key variables influencing future growth include:
- Recovery momentum in revenues after steep recent declines,
- Resumption pace of capital expenditures supporting innovation or market expansion,
- Sustained effectiveness of cybersecurity governance mitigating disruptive risks,
- Evolving market dynamics within its undisclosed sector impacting demand,
- Management commentary providing updated strategic priorities.
Monitoring quarterly revenue trends for signs of stabilization or growth will be essential along with capital allocation shifts toward R&D or technology upgrades that could signal renewed investment appetite.
Meanwhile, the sizeable liquidity cushion affords temporal flexibility allowing the company space to adjust strategies responsively without immediate financing pressure — potentially cushioning cyclical headwinds.
Disclaimer: This memo provides an analytical synopsis based strictly on publicly filed financial data and documented disclosures without offering investment recommendations or price targets.
Disclaimer: This is research-only, informational analysis and not investment advice. It may include AI-generated interpretation and general industry context. Always verify important details using primary sources.
Comments