
International Bancshares Corp’s Regional Edge Supports Steady Earnings and Strategic Capital Moves
Strong presence in Texas-Oklahoma banking markets and diversified loan portfolio underpin International Bancshares’ stable financial profile.
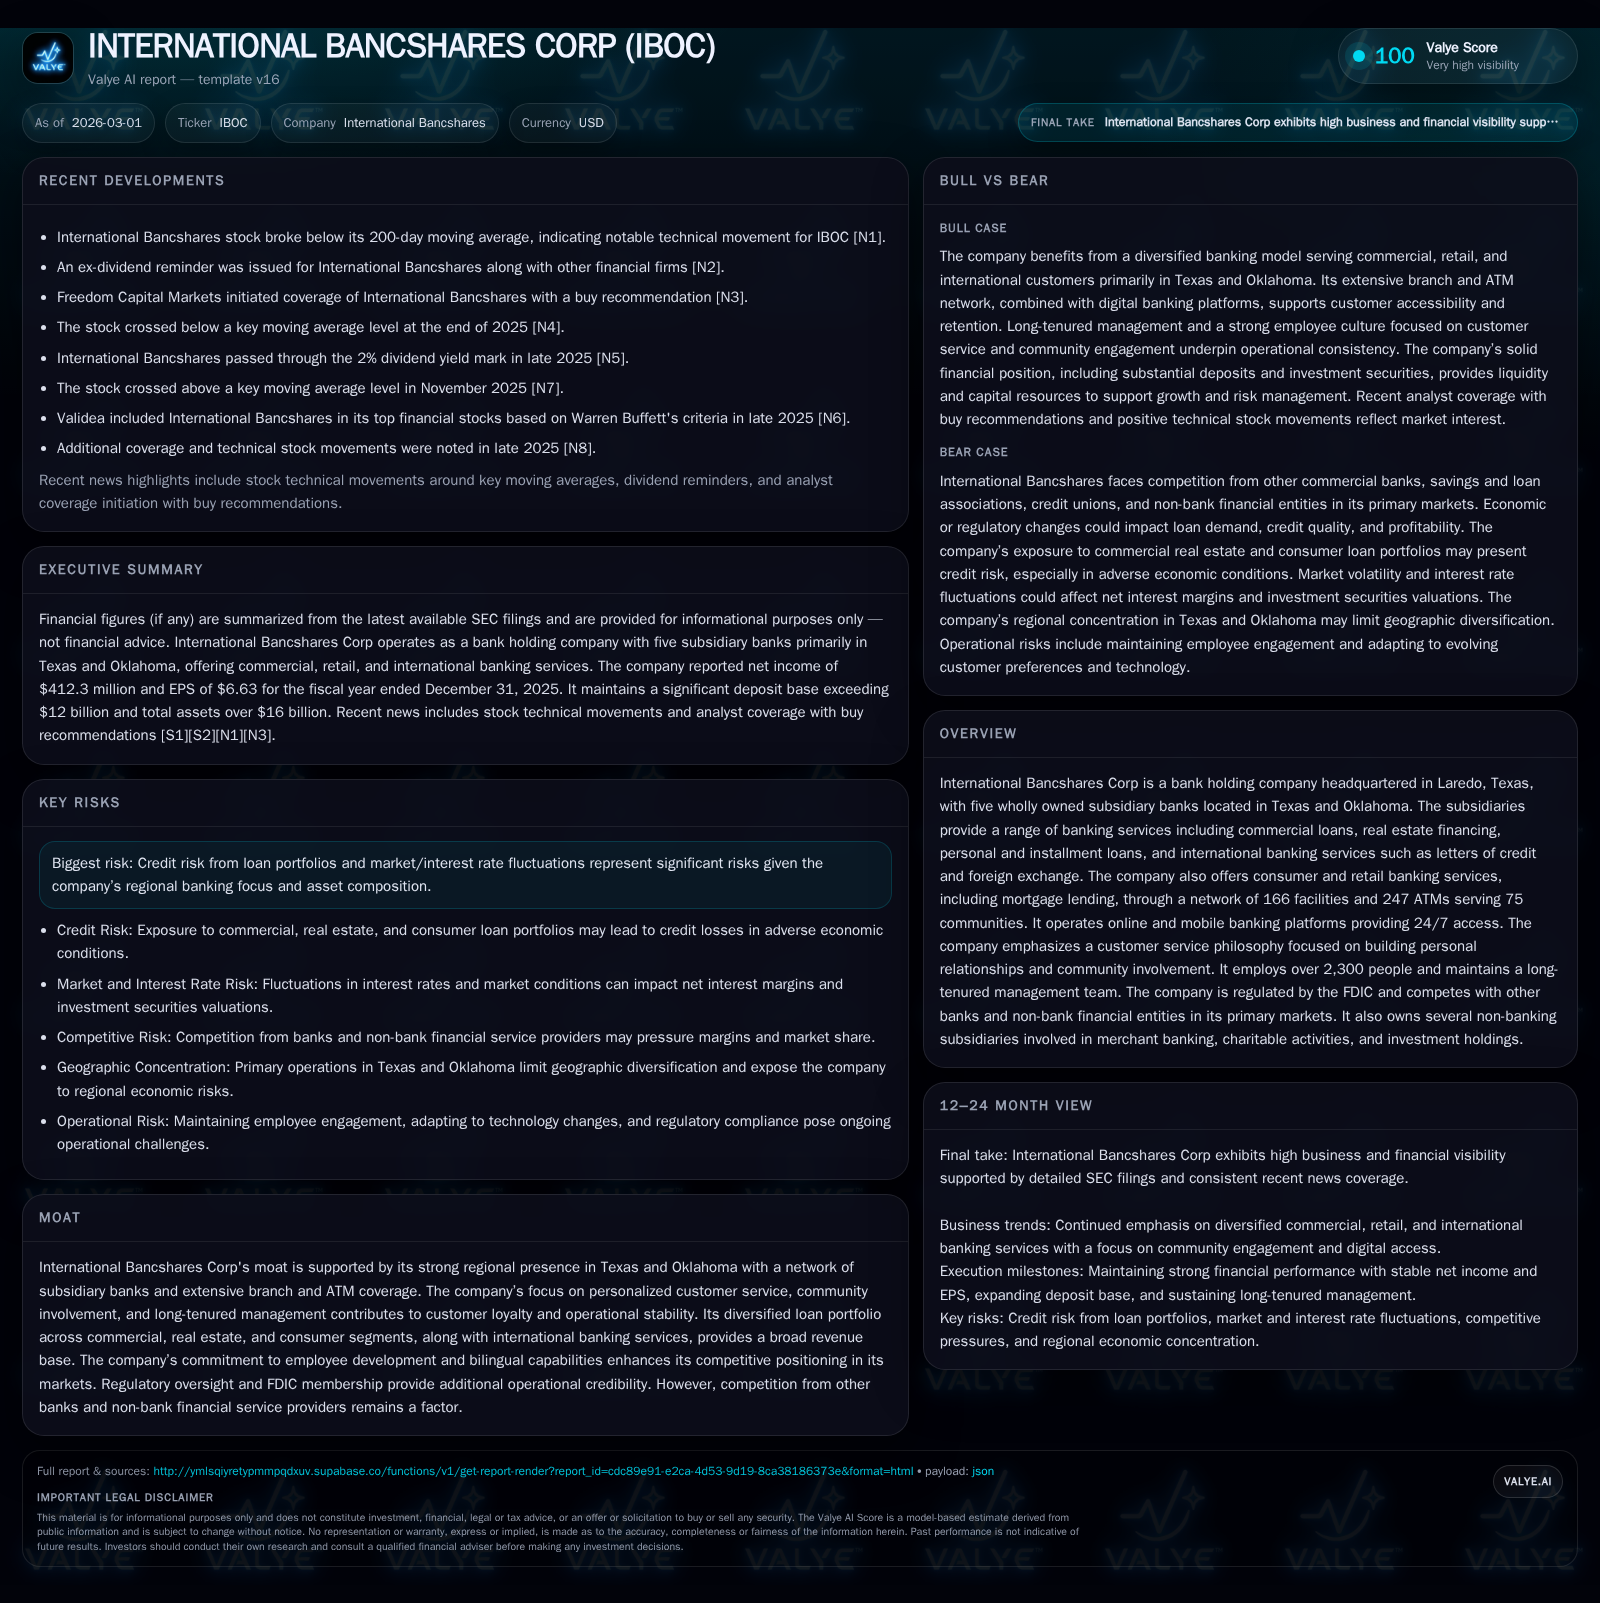
International Bancshares Corp leverages its entrenched regional footprint across Texas and Oklahoma through five wholly owned banks providing comprehensive commercial, real estate, consumer, and international banking services. Its focus on personal customer relationships combined with a loyal bilingual workforce supports operational stability amid competitive pressures. Financially, the company has delivered steady net income growth around 0.8% year over year into FY2025, with robust cash flow generation and disciplined capital allocation maintaining an approximate 12.7% ROE. Risks remain from credit exposure concentrations and interest rate volatility, but ongoing community engagement and careful branch network management foster a defensive moat.
Steady Financial Results Backed by Regional Banking Strengths
International Bancshares Corp (IBOC) builds its operations around five subsidiary banks strategically located within Texas and Oklahoma — including core hubs in Laredo, Brownsville, Zapata (Texas), Oklahoma City, and Laredo’s Commerce Bank [S1]. This network supports retail and commercial banking activities across approximately 75 communities via 166 branch facilities alongside 247 ATMs, reinforcing accessibility in these regional markets [S8].
The company's broad service offering encompasses traditional commercial loans, diverse real estate financing solutions (covering multifamily residential segments among others), personal installment loans, as well as more specialized international banking products such as letters of credit and foreign exchange services that facilitate cross-border trade particularly near the US-Mexico border [S1][S8].
Moreover, IBOC complements its physical footprint with digital channels—IBC Bank Online and mobile banking platforms—that provide customers secure 24/7 account access, reflecting the institution’s adaptation to evolving banking usage patterns [S8]. The bank espouses a philosophy centered on "We Do More," emphasizing personalized customer relationships reinforced by locally appointed advisory boards that help tailor offerings to community needs [S9]. This philosophy is supported by a workforce of over 2,300 employees with a management team whose majority possesses long tenure exceeding fifteen years—a factor that contributes to operational continuity and institutional knowledge [S8].
Key Historical Growth Drivers and Year-over-Year Performance Dynamics
From a financial perspective grounded in public data spanning fiscal years 2022 through 2025 [F1], IBOC exhibits steady profitability with year-over-year net income managing a modest uptick from $409 million in FY2024 to $412 million in FY2025—about a 0.8% increase—following an earlier substantial rise from $300 million in FY2022 driven by loan book growth during post-pandemic economic recovery.
Operating cash flow grew by approximately 3.6% year over year to reach nearly $491 million in FY2025, demonstrating efficient earnings conversion into liquidity [F1]. Notably, capital expenditures increased sharply by 28%, from roughly $14 million to $18 million in the same period—a reflection of targeted branch facility upgrades and technology investments underpinning both physical expansion and digital channel enhancement [F1][S8].
Equity financing demonstrated sustained growth, increasing by more than 12% year over year to just over $3.25 billion at FY2025 end. This equity base expansion sustains IBOC's ability to absorb loan portfolio growth while maintaining capital buffer ratios consonant with FDIC regulatory standards [F1][S1]. These factors culminate in an estimated return on equity (ROE) of approximately 12.7%, signifying capital-efficient profitability within the regional banking context [F1].
Dividends reflect a shareholder-friendly orientation: payouts rose steadily from $82 million in FY2024 to about $87 million in FY2025. Share repurchases were more selective during FY2025 ($4.6 million) compared with previous levels ($52 million in FY2022), indicating cautious capital deployment balanced against organic growth funding needs [F1][N2].
Historical performance (annual)
| FY | Net ($mm) | CFO ($mm) | Capex ($mm) | Net YoY |
|---|---|---|---|---|
| 2025 | 412 | 491 | 18 | +0.8% |
| 2024 | 409 | 474 | 14 | -0.6% |
| 2023 | 412 | 474 | 27 | +37.1% |
| 2022 | 300 | 388 | 19 |
Source: SEC companyfacts cache [F1].
Capital returns and efficiency (annual)
| FY | Div ($mm) | Buybacks ($mm) | FCF ($mm) |
|---|---|---|---|
| 2025 | 87 | 5 | 473 |
| 2024 | 82 | 1 | 460 |
| 2023 | 78 | 5 | 447 |
| 2022 | 75 | 52 | 369 |
Source: SEC companyfacts cache [F1].
Table captures core income statement and cash flow drivers illustrating IBOC's steady profitability and capital return track record.
Outlook: Growth Opportunities and Market Limitations in Core Regions
Looking ahead, International Bancshares benefits from structural demand within its core Texas-Oklahoma footprint for various credit products: commercial loans continue underpinning small- to medium-business financing needs; real estate lending—especially multifamily units—captures demographic-driven housing demand; while consumer lending including mortgages fuels retail banking activity [S1][N1]. The company's strategic community involvement via local advisories aids ongoing product-market fit.
Nonetheless, expansion opportunities may be moderated by increasing competition from both sizable regional banks expanding into Texas markets as well as fintechs offering non-bank financial services that challenge traditional deposit-gathering models [N2][S3]. Additionally, macroeconomic considerations such as regional employment trends or housing price adjustments could influence credit demand.
The competitive environment necessitates continued investment in multi-channel delivery platforms while maintaining the differentiated "relationship banking" model featuring bilingual staff adept at servicing the significant Hispanic population—a distinctive moat element enhancing customer retention [S1]. Balancing these forces will shape achievable growth trajectories.
Capital Allocation Strategy: Dividends, Buybacks, and Return on Equity
IBOC pursues a conservative yet shareholder-responsible capital approach consistent with its function as a bank holding company under FDIC oversight [S9]. Dividend trends showing annual increases demonstrate commitment to returning value reliably; total dividends paid reached approximately $87 million for FY2025 up from $82 million prior year [F1][N2]. Buyback volumes subsided markedly relative to the exceptional levels seen around FY2022 ($52 million), settled at roughly $4.6 million in FY2025—indicating selective repurchase tactics balancing capital preservation against market conditions [F1].
This capital discipline underpins the bank’s ability to sustain an estimated ROE near a healthy double-digit level (~12.7% in FY2025) while maintaining equity buffers that support asset quality under diverse economic scenarios [F1][S1]. Operating cash flow coverage for dividends plus reinvestment remains robust.
Operational Efficiency and Cash Flow Generation Trends
Operating cash flow has evolved positively over recent years alongside controlled expense management particularly relating to branch operations—an expensive line item for community banks [F1][S8]. Capital spending reflects cyclical upgrades in physical locations plus technology investments essential for delivering convenient online/mobile access that meets customer expectations for anytime banking service.[F1][S6]
Management’s emphasis on operational efficiency is evident as free cash flow after capex remains strongly positive ($472 million estimated for FY2025), allowing strategic flexibility to invest or return capital without compromising balance sheet strength [F1]. Ongoing cost control measures paired with technology-driven process improvements align with sector best practices among regionally focused institutions.
Competitive Positioning and the Moat Bolstered by Personalized Service
International Bancshares' moat largely derives from entrenched community ties enhanced through long-serving leadership—where about two-thirds of officers have tenures exceeding fifteen years—which fosters institutional stability uncommon among mid-sized banks [S8]. Such longevity translates into deep client knowledge facilitating tailored financial solutions.
Bilingual capabilities across frontline staff enable effective engagement with Texas’s significant Hispanic demographic—a competitive advantage driving deposit stickiness and diverse loan origination opportunities [S1]. Such relationship banking mitigates commoditization risks inherent in open deposit markets.
Further strengthening positioning is diversified loan mix mitigating localized downturn impact: commercial credits blend with real estate segments including agricultural farmland exposure distinctively tied to regional economics provides breadth while international trade finance supports niche cross-border flows unique among peers.
Risks from Credit Exposure and Market Interest Rates to Monitor
Despite diversification benefits, concentrated credit risk remains salient given portfolio composition weighted toward commercial real estate loans susceptible to market corrections or borrower stress during tightening economic cycles [S1][F1]. Elevated watchfulness on non-performing asset metrics is crucial especially amid evolving macroeconomic uncertainties.
Interest rate fluctuations directly affect net interest margins—the primary earnings driver for banks—with potential margin compression if funding costs rise faster than asset yields or if competitive pricing pressures discount spreads [S1][F1]. Regulatory compliance under FDIC supervision imposes conservative capital requirements but demands rigorous risk management vigilance.
What to Watch: Upcoming Earnings Milestones and Strategic Initiatives
Investors should monitor forthcoming quarterly earnings releases for updates on net interest margin trends, asset quality indicators such as non-performing assets ratio movements, as well as disclosure concerning capital deployment including dividend policy evolutions or potential buyback programs beyond the subdued recent pace [N1][N2][S3].
Strategically, incremental progress or announcements pertaining to digital channel enhancements—including expanded mobile functionality or new fintech partnerships—could serve as catalysts improving competitive positioning within fast-evolving customer preferences not explicitly forecasted but inferred from ongoing investment trends highlighted in filings [S8][S6].
Continued defense of regional market share through community engagement efforts remains critical amidst intensifying bank/non-bank competition dynamics.
Disclaimer: This report is prepared solely for informational purposes based on publicly available data including SEC filings and industry news; it does not constitute investment advice or recommendations.
Disclaimer: This is research-only, informational analysis and not investment advice. It may include AI-generated interpretation and general industry context. Always verify important details using primary sources.
Comments