
Safe Bulkers Navigates Market Challenges with Fleet Renewal and Steady Capital Returns in 2025
Safe Bulkers’ 2025 financial results reflect reduced earnings amid market softness, supported by a disciplined fleet renewal strategy and consistent capital allocation.
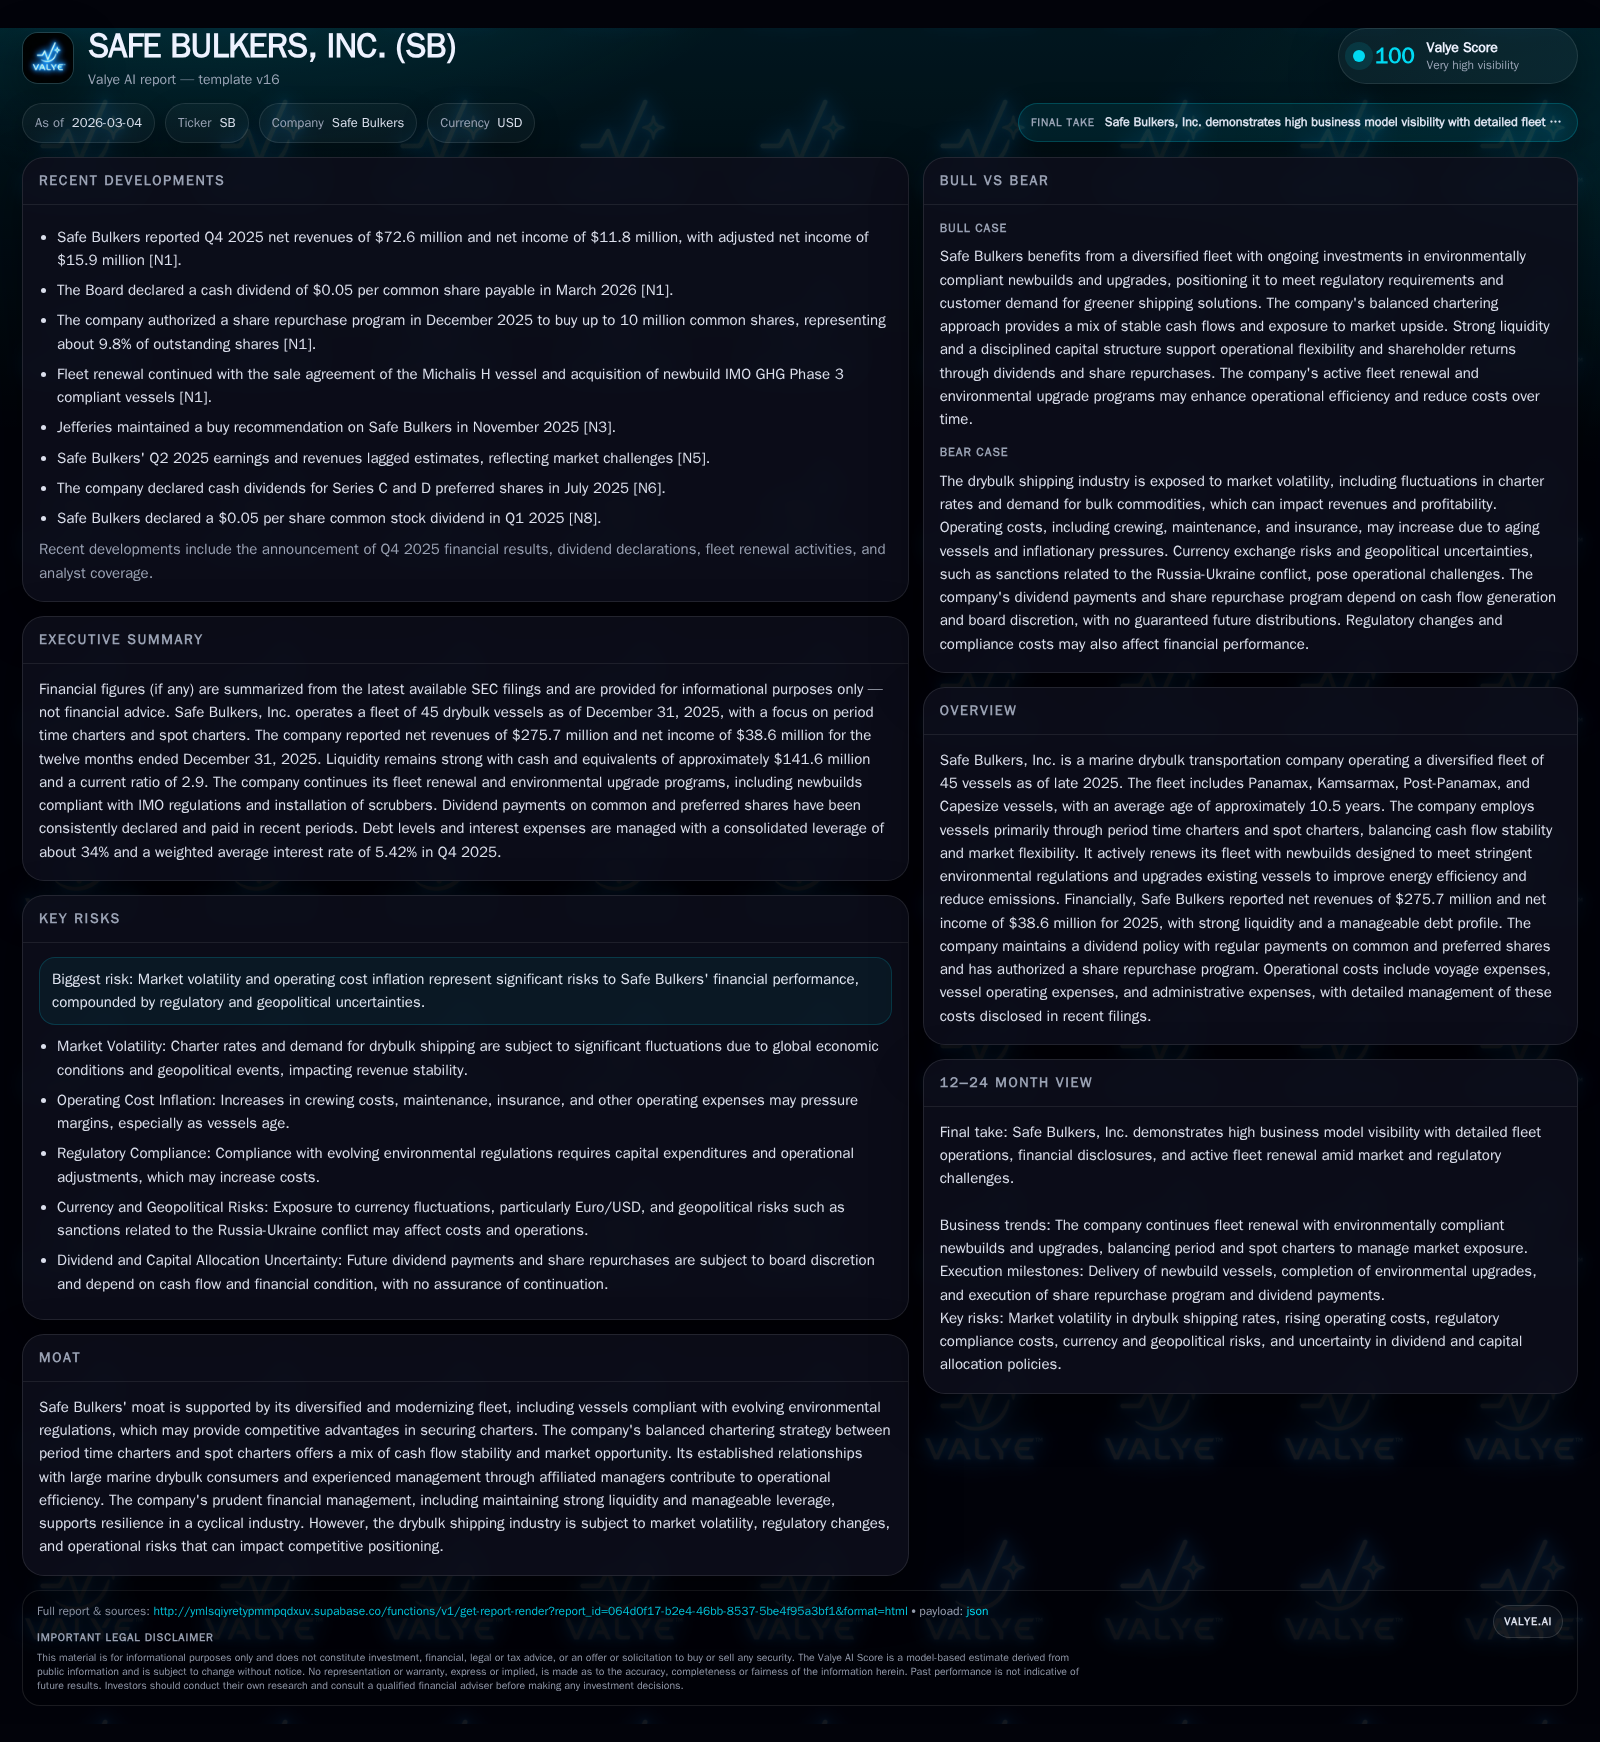
Safe Bulkers, Inc. reported a significant decline in operating and net income for 2025, impacted by weaker drybulk freight rates and rising operating costs. The company operates a fleet of 45 vessels averaging about 10.5 years in age, complemented by six newbuilds scheduled through 2029 to enhance environmental compliance and efficiency. A balanced charter mix provides revenue stability while allowing market flexibility. The firm maintains strong liquidity, pays quarterly dividends on both common and preferred shares, and has authorized a $10 million common stock repurchase program to support shareholder returns. Key milestones include new vessel deliveries, charter contract renewals, and monitoring inflationary pressures on operating expenses.
Fleet Composition and Financial Performance
As of December 31, 2025, Safe Bulkers operated a fleet of 45 drybulk vessels spanning Panamax, Kamsarmax, Post-Panamax, and Capesize classes with an average age around 10.5 years . The company’s orderbook includes six newbuilds scheduled for delivery through 2029 aimed at modernizing the fleet with enhanced environmental features [S3].
Financially, Safe Bulkers reported operating income of $69.97 million in fiscal year 2025, down approximately 45.5% from $128.43 million in the prior year [F1]. Net income declined more sharply by about 60.4%, reaching $38.56 million compared to $97.38 million in FY2024 [F1]. These declines reflect a combination of weakening drybulk freight markets during late 2024 into 2025 alongside rising operational costs.
Net revenues decreased from $307.6 million in FY2024 to $275.7 million in FY2025 as average daily time charter equivalent (TCE) rates softened from $17,602 to roughly $15,511 [N1][F1]. While the diversified fleet offers some insulation across vessel segments, profitability was pressured amid global shipping rate cyclicality.
Balanced Charter Strategy for Stability and Upside
The company employs a hybrid charter model combining period time charters with spot charters to balance revenue predictability and market responsiveness [S1][N1]. Period time charters provide steady cash flows with charterers typically responsible for most voyage expenses such as bunker fuel costs during cargo voyages.
Spot charters allow Safe Bulkers to capture short-term market opportunities but introduce higher revenue volatility.
In Q4-2025, TCE rates averaged approximately $17,050 per day compared with around $16,521 in Q4-2024, suggesting modest recovery potential tempered by cost pressures [N1]. Management continues to emphasize maintaining this balanced employment mix as a risk mitigation approach amidst uncertain geopolitical factors impacting drybulk demand.
Operating Cost Dynamics
Voyage expenses primarily include bunker fuel consumed during ballast legs (when vessels sail without cargo), which are not reimbursed by charterers, along with minor miscellaneous charges [S1]. Elevated bunker prices during repositioning periods contributed to increased voyage costs.
Vessel operating expenses encompass crew wages (notably many paid in foreign currencies such as Euros), insurance premiums reflecting global risk exposures, spare parts procurement, maintenance activities including drydocking and classification surveys essential for vessel certification [S1][N1].
Daily vessel operating expenses averaged approximately $5,790 in FY2025 compared to about $5,510 in FY2024 driven by wage inflation, higher insurance costs, and increased maintenance requirements associated with an aging fleet segment [N1][S21]. Currency fluctuations can also materially impact crew-related expenses.
Environmental Compliance and Capital Expenditures
Safe Bulkers is investing in newbuild vessels designed to comply with International Maritime Organization regulations targeting carbon intensity reductions and emissions controls [S6]. Retrofitting existing vessels with scrubbers or other green technologies is also part of ongoing capital expenditure plans.
Capital spending related directly to newbuild commitments accounted for the main outlays recently; general maintenance capex has been limited according to filings [F1].
Strong Liquidity and Capital Allocation Discipline
The company held cash and cash equivalents of approximately $141.58 million at December 31, 2025 with a healthy current ratio near 2.9x indicating ample short-term liquidity [F1]. Undrawn credit facilities further bolster financial flexibility.
Safe Bulkers maintains a consistent dividend policy paying quarterly dividends on common stock ($0.05 per share) since re-establishing payments in March 2022 as well as regular quarterly dividends on Series C/D preferred shares ($0.50 per share) over recent years [S1][S17].
In December 2025, the company authorized a common stock repurchase program allowing up to ten million shares (approximately 9.8% of outstanding shares) funded from existing cash resources [S7][N1]. Modest buyback activity occurred during the year totaling about $11 million as part of capital return initiatives [F1].
Debt Profile and Interest Rate Risk Management
Total loans outstanding remained stable at approximately $548 million as of December 31, 2025 with maturities well spread into the late-2020s [S9][S14]. The company uses interest rate swaps covering notional amounts up to $50 million to mitigate floating rate exposure tied to SOFR-based debt facilities [S4][S8], reducing volatility from interest rate fluctuations.
Historical Financial Summary
Historical performance (annual)
| FY | Net ($mm) | CFO ($mm) | OpInc ($mm) | Capex | Net YoY |
|---|---|---|---|---|---|
| 2025 | 39 | 102 | 70 | -60.4% | |
| 2024 | 97 | 130 | 128 | +25.9% | |
| 2023 | 77 | 122 | 104 | 0 | -55.2% |
| 2022 | 173 | 218 | 185 | 0 |
Source: SEC companyfacts cache [F1].
Capital returns and efficiency (annual)
| FY | Buybacks ($mm) | FCF ($mm) | ROE% |
|---|---|---|---|
| 2025 | 11 | 4.6 | |
| 2024 | 29 | 11.7 | |
| 2023 | 26 | 122 | 9.8 |
| 2022 | 9 | 218 | 22.4 |
Source: SEC companyfacts cache [F1]. | *Note: Capex minimal except pre-2023 periods; Buybacks represent share repurchases completed within each calendar year; ROE approximate based on net income/equity end-of-year values.[F1]
Milestones Ahead: Monitoring Growth Drivers and Cost Pressures
Key upcoming developments investors should track include:
- Delivery of six contracted newbuild vessels through to 2029 supporting fleet modernization efforts [S3];
- Renewal or expiration status of major period time charters impacting future contracted revenue backlog;
- Inflationary trends affecting bunker fuel prices, crew wages (currency effects), insurance premiums and maintenance costs;
- Progress on environmental compliance initiatives including retrofits aligned with IMO targets;
- Activity under the common stock repurchase authorization balanced against dividend policy decisions;
- Quarterly TCE rate movements signaling freight market conditions amidst ongoing geopolitical uncertainties.
Together these factors will shape Safe Bulkers’ ability to sustain earnings resilience while managing capital returns amid volatile drybulk market dynamics.
This analysis is based exclusively on publicly filed SEC documents including Safe Bulkers’ Form 20-F annual report dated March 4, 2026 ([S1]), Form 6-K quarterly updates ([S2],[S3]), related earnings call transcripts ([N1]), and XBRL financial data ([F1]). No speculative forecasts have been included beyond disclosed information.
Disclaimer: This is research-only, informational analysis and not investment advice. It may include AI-generated interpretation and general industry context. Always verify important details using primary sources.
Comments