
ICE’s Multi-Asset Engine: Trading Volume Trends and Recurring Revenue Power Its Next Growth Phase
Intercontinental Exchange, Inc. (ICE) delivered robust growth in trading and recurring services in 2025, powered by surging volumes in energy and financial futures and a significant uptick in cash equities. As competitive and regulatory pressures intensify, the company’s blend of transaction-based and subscription-like revenues will determine its resilience—and the durability of its operating leverage.
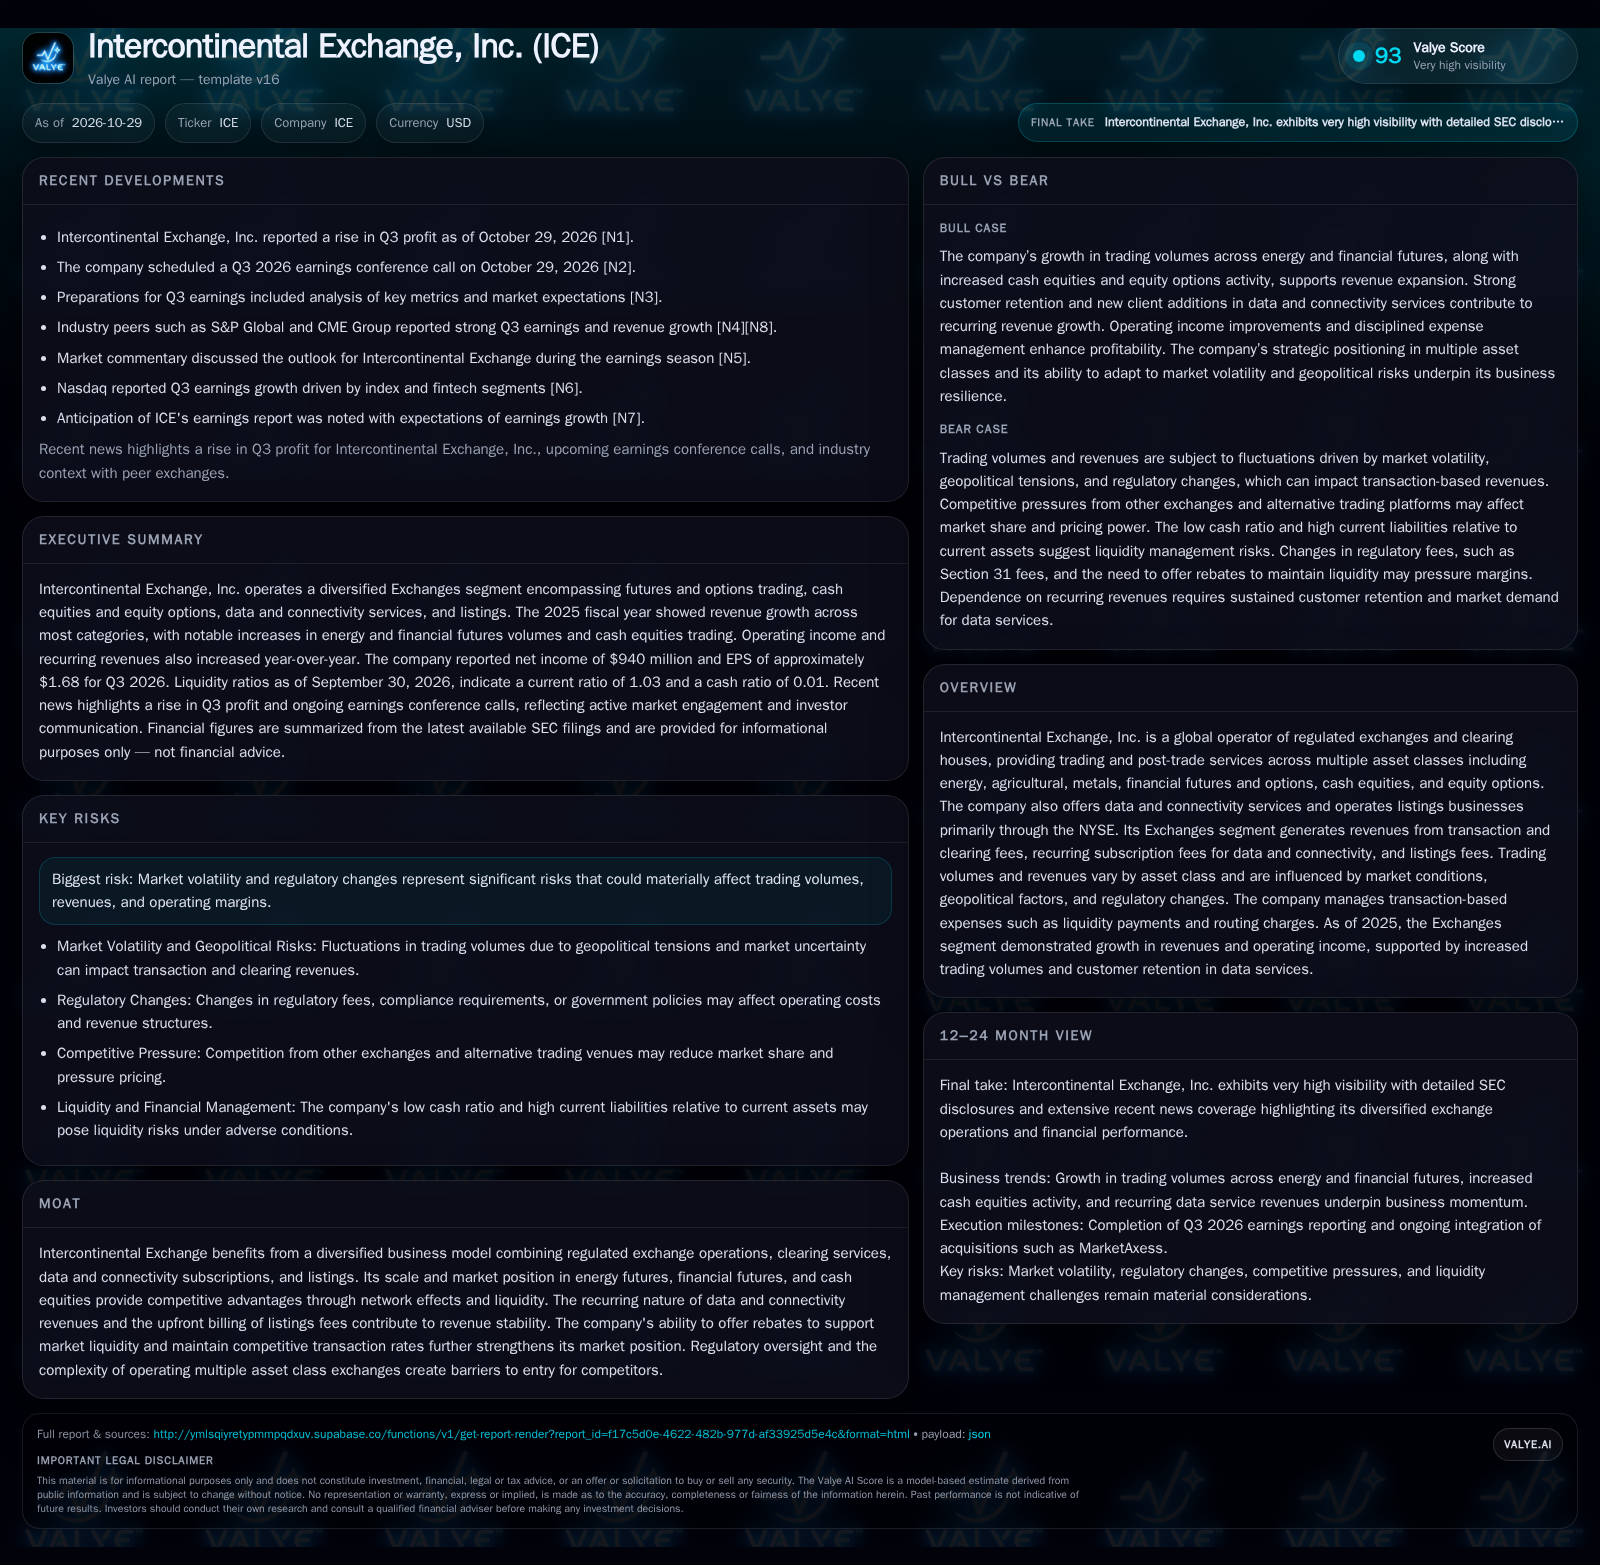
ICE posted strong 2025 revenue and operating income growth, with energy and financial futures and cash equities volumes leading the surge.Recurring data and connectivity revenues also grew, but a reported cash ratio highlights ongoing liquidity management needs. The company’s ability to maintain and expand its multi-asset exchange model amid shifting market conditions and competition will be central to its future performance. [S1] [S2]
Intercontinental Exchange, Inc. (ICE) stands at the intersection of global capital flows, commodity markets, and financial technology, operating a portfolio that spans futures, options, cash equities, and high-margin data services. The company’s 2025 results signal continued momentum, with double-digit growth in core trading categories and expanding recurring revenues from data and listings. The next phase will test whether its scale and diversification can outpace the rising risks and shifting market dynamics. [S1] [S2]
2025 Performance Review: Volume Increases and Recurring Revenue Expansion Amid Tight Liquidity
ICE’s Exchanges segment posted $8.12 billion in revenue for 2025, a 9% year-over-year increase, with transaction and clearing revenues net of rebates at $6.594 billion, up 10%. Operating income rose 10% to $3.982 billion, indicating solid operating leverage as expenses grew more slowly than revenues. Recurring data and connectivity services and listings revenue reached $1.526 billion, up 6%, supporting revenue visibility. Trading volume growth was strongest in energy (up 14%) and financial futures/options (up 16%), while cash equities volume soared 40%. Agricultural and metals futures/options volumes declined 9%, highlighting asset class cyclicality. As of September 2026, ICE reported $936 million in cash and equivalents, with a current ratio of 1.03 and a cash ratio of 0.01, reflecting a tightly managed liquidity profile. Net income for Q3 2026 was $940 million, with basic EPS of $1.68. [S1] [S2]
Revenue Composition and Operating Leverage as Key Drivers of ICE’s Profitability
ICE’s business model is fundamentally a blend of transaction-based fees (from trading and clearing across asset classes) and recurring revenues (primarily from data, connectivity, and listings). Transaction and clearing revenues are volume-driven and sensitive to market volatility, regulatory changes, and macroeconomic trends. Recurring data and connectivity revenues, while smaller in absolute terms, offer higher visibility and margin stability, as these are typically structured as subscription contracts or annual listings fees, often billed upfront.
The company’s scale and technology infrastructure mean that incremental trading volume—especially in high-margin futures and options—can drive significant operating leverage. Fixed costs (platform infrastructure, regulatory compliance, personnel) are high, but marginal costs per trade are low, so surges in volume (as seen in 2025) disproportionately benefit operating income. Conversely, a sharp decline in trading activity would reveal the inherent fixed-cost risk.
Liquidity management is critical. The company reported cash and liquidity metrics for the period; these figures do not by themselves establish operating runway, investment capacity, financial flexibility, or financing capacity.
ICE’s Competitive Edge: Multi-Asset Breadth, Subscription Revenue, and Structural Defenses
ICE’s competitive position rests on its breadth across asset classes (energy, financials, cash equities, agricultural, and metals), its network effects (liquidity attracts liquidity), and the stickiness of its data and connectivity services. The company’s ability to offer integrated trading, clearing, and data solutions creates switching frictions for institutional customers, particularly those leveraging analytics and compliance tools across multiple markets.
However, competitive threats persist. Other global exchange operators (such as CME Group, Nasdaq, and Euronext) and alternative trading venues (including dark pools and electronic communication networks) continually vie for order flow, often competing on price or offering differentiated liquidity pools. Regulatory changes can also erode barriers, for example by mandating open access or reducing allowable fees.
Technology substitution—particularly the rise of decentralized finance and blockchain-based settlement—could eventually challenge traditional clearing models, but adoption in core regulated markets remains slow. The key question is whether ICE can continue to add value through bundled data/connectivity and maintain its role as a central liquidity hub as market structure evolves.
Factors That Could Propel ICE Beyond Expectations: Volatility, Data Monetization, and Market Penetration
A favorable scenario for ICE would see sustained or heightened market volatility—driven by interest rate uncertainty, geopolitical disruptions, or commodity supply shocks—fueling further surges in trading volumes, particularly in energy and financial futures. If the company can convert this activity into higher-margin clearing and transaction revenues while containing rebate and routing costs, operating leverage could expand further.
Additionally, if ICE successfully upsells new data analytics, compliance tools, or connectivity upgrades to its institutional client base, recurring revenue growth could accelerate, further stabilizing earnings and supporting higher valuation multiples. Market share gains in underpenetrated asset classes or new regions could also provide incremental growth.
Evidence for this scenario would include continued double-digit volume growth in key futures/options products, above-trend increases in data and connectivity revenues, and margin expansion despite competitive or regulatory headwinds. Announced new product launches, customer wins in data services, or expansions into new asset classes would further confirm momentum.
Projected Path for ICE: Sustained Growth, Stable Margins, and Gradual Market Expansion
The most plausible scenario is that ICE sustains modest growth in trading volumes—benefiting from ongoing macro volatility but facing normalization in certain asset classes (such as agricultural and metals, which declined in 2025). Recurring revenues from data and listings continue to grow at mid-single-digit rates, driven by customer retention and gradual upsell rather than outsized new wins.
Operating margins remain robust, with incremental efficiency gains offsetting inflationary cost pressures and the need for ongoing investment in technology and regulatory compliance. Competitive pricing pressures and periodic regulatory fee adjustments temper the pace of revenue growth but do not erode the core economics.
Confirming evidence would include steady year-over-year growth in both transaction-based and recurring revenues, stable or slightly improving operating income margins, and ongoing customer retention in data/connectivity. Falsification would be signaled by a sharp decline in volumes across multiple asset classes or unexpected margin compression.
Potential Challenges for ICE: Volume Volatility, Regulatory Pressures, and Liquidity Constraints
The adverse scenario centers on a sharp, sustained decline in trading volumes, triggered by a collapse in market volatility, a shift of order flow to alternative trading venues, or regulatory actions (such as fee caps or increased compliance burdens). If volumes in core futures and equities segments fall, the fixed-cost base would amplify the impact on profitability.
Significant new regulation—such as a hike in transaction taxes, stricter margin requirements, or restrictions on data pricing—could directly compress revenues and require costly system upgrades. Competitive responses, such as aggressive fee cuts by rivals or technological disruptions (e.g., widespread adoption of decentralized clearing), could erode ICE’s market share and pricing power.
In a stress scenario, difficulty rolling over short-term funding or a sudden counterparty default could strain clearing operations and force asset sales or emergency borrowing.
Evidence supporting this scenario would include multi-quarter declines in trading volumes across major asset classes, margin compression, negative operating leverage, and signs of financial strain in liquidity disclosures or credit ratings.
Market Developments That Could Influence ICE’s Strategic Position
Sustained year-over-year growth rates in energy and financial futures/options trading volumes.
Recurring data and connectivity revenue growth above mid-single digits, indicating successful upsell or product innovation.
Operating income margin trends—whether margin expansion continues or begins to compress relative to historical averages.
Updates on regulatory changes affecting transaction fees, listing requirements, or data pricing structures.
New product launches or strategic partnerships in data analytics, connectivity, or underpenetrated asset classes.
Customer retention and churn rates in data and connectivity services, if disclosed, to gauge recurring revenue durability.
Material shifts in competitive pricing or the emergence of alternative trading venues that could impact ICE’s market share.
Disclaimer: This is research-only, informational analysis and not investment advice. It may include AI-generated interpretation and general industry context. Always verify important details using primary sources.

Comments