
Janus Henderson Group Eyes Growth with Strategic Acquisition and Diversified Asset Platform
The integration of Richard Bernstein Advisors alongside a broad investment offering underpins Janus Henderson's growth trajectory despite recent earnings headwinds.
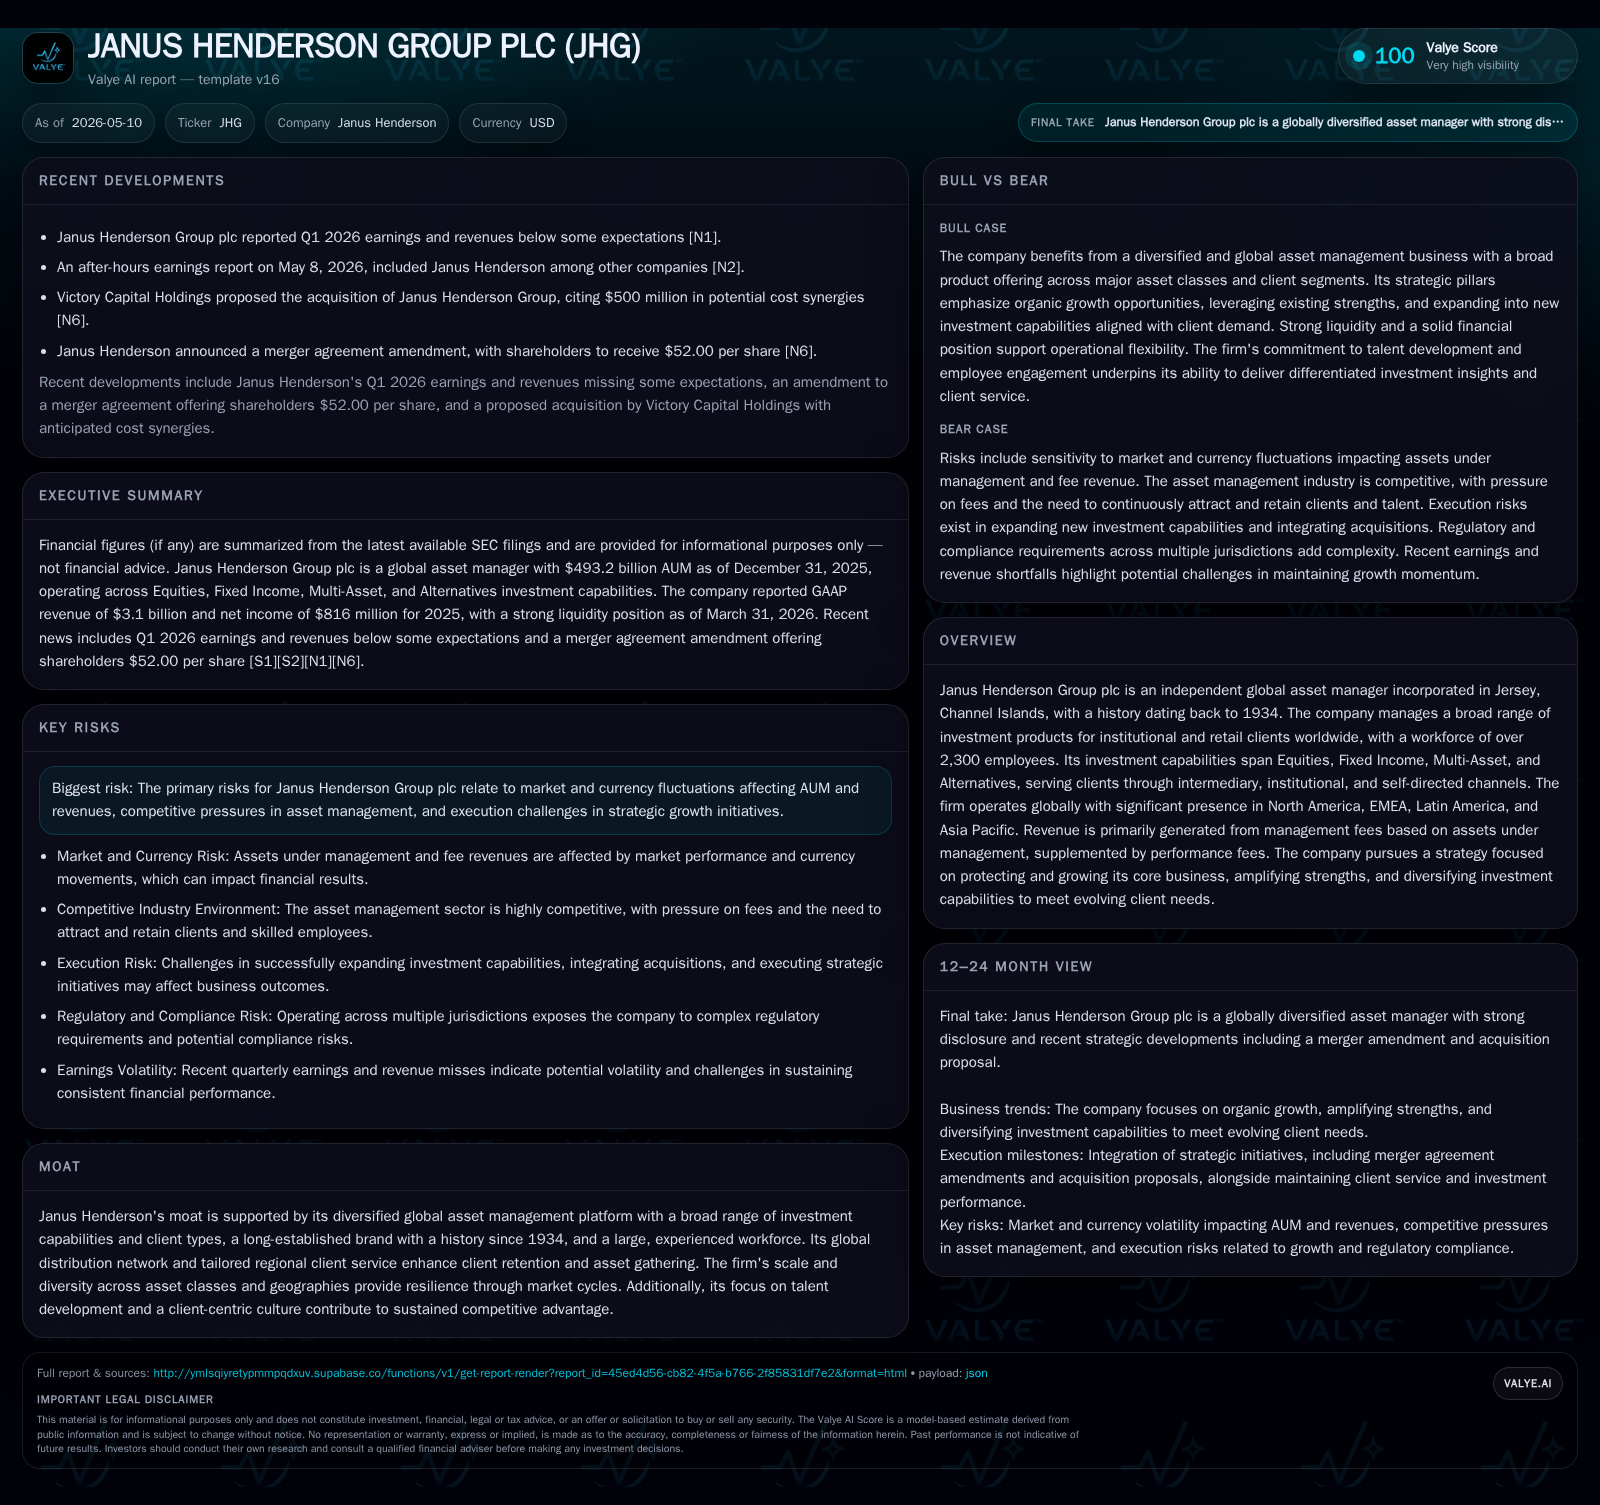
Janus Henderson Group plc reported Q1 2026 results that fell short of estimates, impacted by transitional costs and market conditions ahead of the full integration of its recent acquisition, Richard Bernstein Advisors (RBA). The firm operates a diversified global asset management platform managing roughly $493 billion in assets, generating revenues primarily from management and performance fees across equities, fixed income, multi-asset, and alternatives. It benefits from scale, geographic reach, and a strategic acquisition pipeline designed to enhance capabilities and client penetration. Key risks include market volatility, regulatory compliance complexities especially on ESG mandates, currency shifts, and integration execution. Janus Henderson’s strong balance sheet with net cash positions the company to pursue growth and withstand industry cyclicality.
Q1 Operating Update and Strategic Acquisitions
Janus Henderson Group’s first quarter ending March 31, 2026 disclosed in the May 8th Form 10-Q revealed operating challenges aligned with the recent acquisition of Richard Bernstein Advisors (RBA). While RBA closed on April 1st post-quarter-end, its approximately $20 billion assets under management will start contributing from Q2 onward. The acquisition is treated as a business combination under ASC 805; however, the definitive purchase price allocation is still pending, leaving goodwill and intangible asset values subject to future adjustment [S2][S14].
The firm reported first-quarter earnings that missed market estimates amidst this transitional phase accompanied by market headwinds impacting asset growth and fee income generation [N1][S3]. Early earnings shortfalls likely reflect integration expenses as well as competitive pricing pressures within asset management during volatile markets. This temporal impact sets a cautious tone ahead of anticipated scale benefits upon full consolidation of RBA operations.
Business Model and Investment Offerings
Originating from predecessor entities founded in 1934, Janus Henderson operates as an independent global asset manager with roughly $493 billion in assets under management as of December 31, 2025 [S1]. Revenue principally derives from recurring management fees based on client assets under management (AUM), supplemented by performance fees linked to fund outperformance relative to benchmarks.
The product lineup spans four core investment capabilities: Equities, Fixed Income, Multi-Asset solutions, and Alternatives encompassing private credit and specialist strategies. These offerings serve diverse client segments including institutions, intermediaries, and self-directed retail investors globally [S1]. Fee structures are sensitive to both AUM levels influenced by market fluctuation and investment performance resulting in variable performance fee income.
Strategically important is Janus Henderson’s ability to cross-sell complementary strategies within its multi-asset framework while tailoring regional client servicing backed by a strong distribution network. Its active management philosophy focuses on achieving persistent outperformance across its higher-margin multi-asset and alternative strategies.
Competitive Landscape and Industry Positioning
Janus Henderson competes amid a crowded global asset management ecosystem dominated by large incumbents with scale advantages alongside nimble boutique firms specializing in specific niches. It leverages its independent status combined with a broad product suite to appeal across institutional mandates and retail channels.
Geographically diversified operations cover North America—the largest revenue contributor—Europe including the UK and Luxembourg hubs, Latin America, Asia Pacific, and Australia [S1][S20]. This spread cushions against region-specific market cycles or regulatory shocks.
Heightened regulatory scrutiny on disclosures relating to Environmental, Social and Governance (ESG) factors exerts growing compliance complexity; continuing shifts such as the SEC’s evolving stance on climate-related financial disclosures in the U.S., the EU’s Corporate Sustainability Reporting Directive (CSRD), Sustainable Finance Disclosure Regulation updates, plus emerging UK sustainability standards impose ongoing operational costs [S22][S28]. The firm appears well-equipped but must sustain proactive regulatory adaptation.
While passive investing trends have intensified competition within some categories—especially equities—Janus Henderson's focus on differentiated active solutions serves as a moat by attracting clients seeking alpha beyond benchmark returns.
Growth Drivers and Strategic Initiatives
Janus Henderson’s growth strategy centers on three pillars: Protect & Grow core business through enhancing existing capabilities; Amplify via strategic partnerships and geographic expansion; Diversify through acquisitions such as RBA (multi-asset focus) and Victory Park Capital Advisors (private credit exposure) broadening alternatives offerings [S1][S14][S23].
Organic growth is fostered by consistent investment performance — particularly notable in multi-asset strategies showing outperformance percentages exceeding 90% over multiple horizons — which supports premium fee capture [S1]. Cross-selling integrated products enhances wallet share within existing client bases.
Inorganic growth is disciplined: acquisitions aim for scale expansion aligned with culture fit. For instance, the RBA acquisition adds a macro-driven research capability appealing to institutional investors emphasizing macro themes in portfolio construction. Similarly, strategic partnerships like Guardian Life Insurance expand fixed income mandates ensuring steady fee streams [S23][N4].
Investments into digital transformation continue as well; the firm is preparing for new internal-use software capitalization guidance effective FY2028 impacting accounting treatment but promoting efficiency gains [S25]. Enhanced data analytics capability will support tailored client solutions.
Risks and Execution Challenges
Market volatility remains the foremost risk impacting AUM totals which underpin fee revenue. Given global operations spanning multiple currencies including USD, GBP, EUR among others CNX exposures also affect translated revenue comparability [S28][N1]. Regulatory shifts especially escalating ESG disclosure demands raise compliance costs with uncertain scope or timing adding a layer of operational risk.
Integration risks surface notably with RBA where pending purchase price allocation injects some balance sheet uncertainty until finalized. Synergy achievement rests on smooth cultural assimilation and retention of specialized talent critical for sustaining product performance.
Additional liquidity risk factors stem from seed capital commitments embedded within certain investment products requiring liquidity provisioning when portfolio companies request funding—their valuation inputs remain partially reliant on NAV practical expedients emphasizing valuation subjectivity risks [S2].
Finally competitive pressures may enforce margin compression driven by increasing demands for fee transparency along with pressure from low-cost passive alternatives challenging active management pricing power.
What to Watch in Upcoming Quarters
Key near-term monitoring points include the completion of purchase price allocation for RBA allowing full reflection of goodwill/intangible impacts by mid-2026 [S2][S14]. The Q2 consolidate financial statements will mark first earnings contribution from RBA operations offering clearer insight into acquisition accretion potential.
Investor focus should also target organic AUM trends post-Q1 given recent headwinds plus expense discipline metrics signaling operational efficiency amid integration cost absorption phases.
Management commentary through upcoming earnings disclosures will be pivotal to assessing synergy capture progress alongside digital platform enhancements designed to maintain competitive differentiation.
Further regulatory developments pertaining to sustainability reporting standards could influence compliance cost trajectories warranting vigilance.
Latest Financial Snapshot and Capital Structure
Latest financial snapshot
| Metric | Value | Period |
|---|---|---|
| Cash & equivalents | $1381mm | |
| 2026-03-31 | ||
| Total debt | $698mm | |
| 2026-03-31 | ||
| Net debt | $-683mm | |
| 2026-03-31 | ||
| Current assets | $3.3bn | |
| 2026-03-31 | ||
| Current liabilities | $859mm | |
| 2026-03-31 | ||
| Current ratio | 3.89x | |
| 2026-03-31 |
Source: SEC companyfacts cache [F1].
Janus Henderson's balance sheet remains robust as of March 31, 2026:
| Metric | Value |
|---|---|
| Cash & Equivalents | $1.381B |
| Total Debt | $698M |
| Net Debt | -$683M (Net Cash) |
| Current Assets | $3.34B |
| Current Liabilities | $859M |
| Current Ratio | 3.89 |
The firm holds significant liquidity with approximately double cash relative to debt obligations providing ample capacity for ongoing investments or opportunistic M&A activity without leveraging financial risk excessively [F1][S2]. This conservative leverage posture supports operational flexibility amidst industry cyclicality.
This analysis reflects Janus Henderson Group plc's operating environment grounded strictly in disclosed quarterly filings dated May 8, 2026 ([S2], [S3], [S14]), annual context from February 25 filings ([S1], [S22], [S28]), supplemented with recent news sources ([N1], [N4]) combined with appropriate financial statements per company facts ([F1]). No speculative conclusions beyond presented evidence have been drawn. The firm’s prospects hinge importantly on successful integration of RBA paired with maintaining differentiated active asset management amid evolving market dynamics.
Disclaimer: This is research-only, informational analysis and not investment advice. It may include AI-generated interpretation and general industry context. Always verify important details using primary sources.
Comments