
John Marshall Bancorp Balances Regional Growth and Credit Concentration Risks
The bank leverages local market expertise in the competitive Washington D.C. metro area while managing risks inherent to concentrated real estate lending.
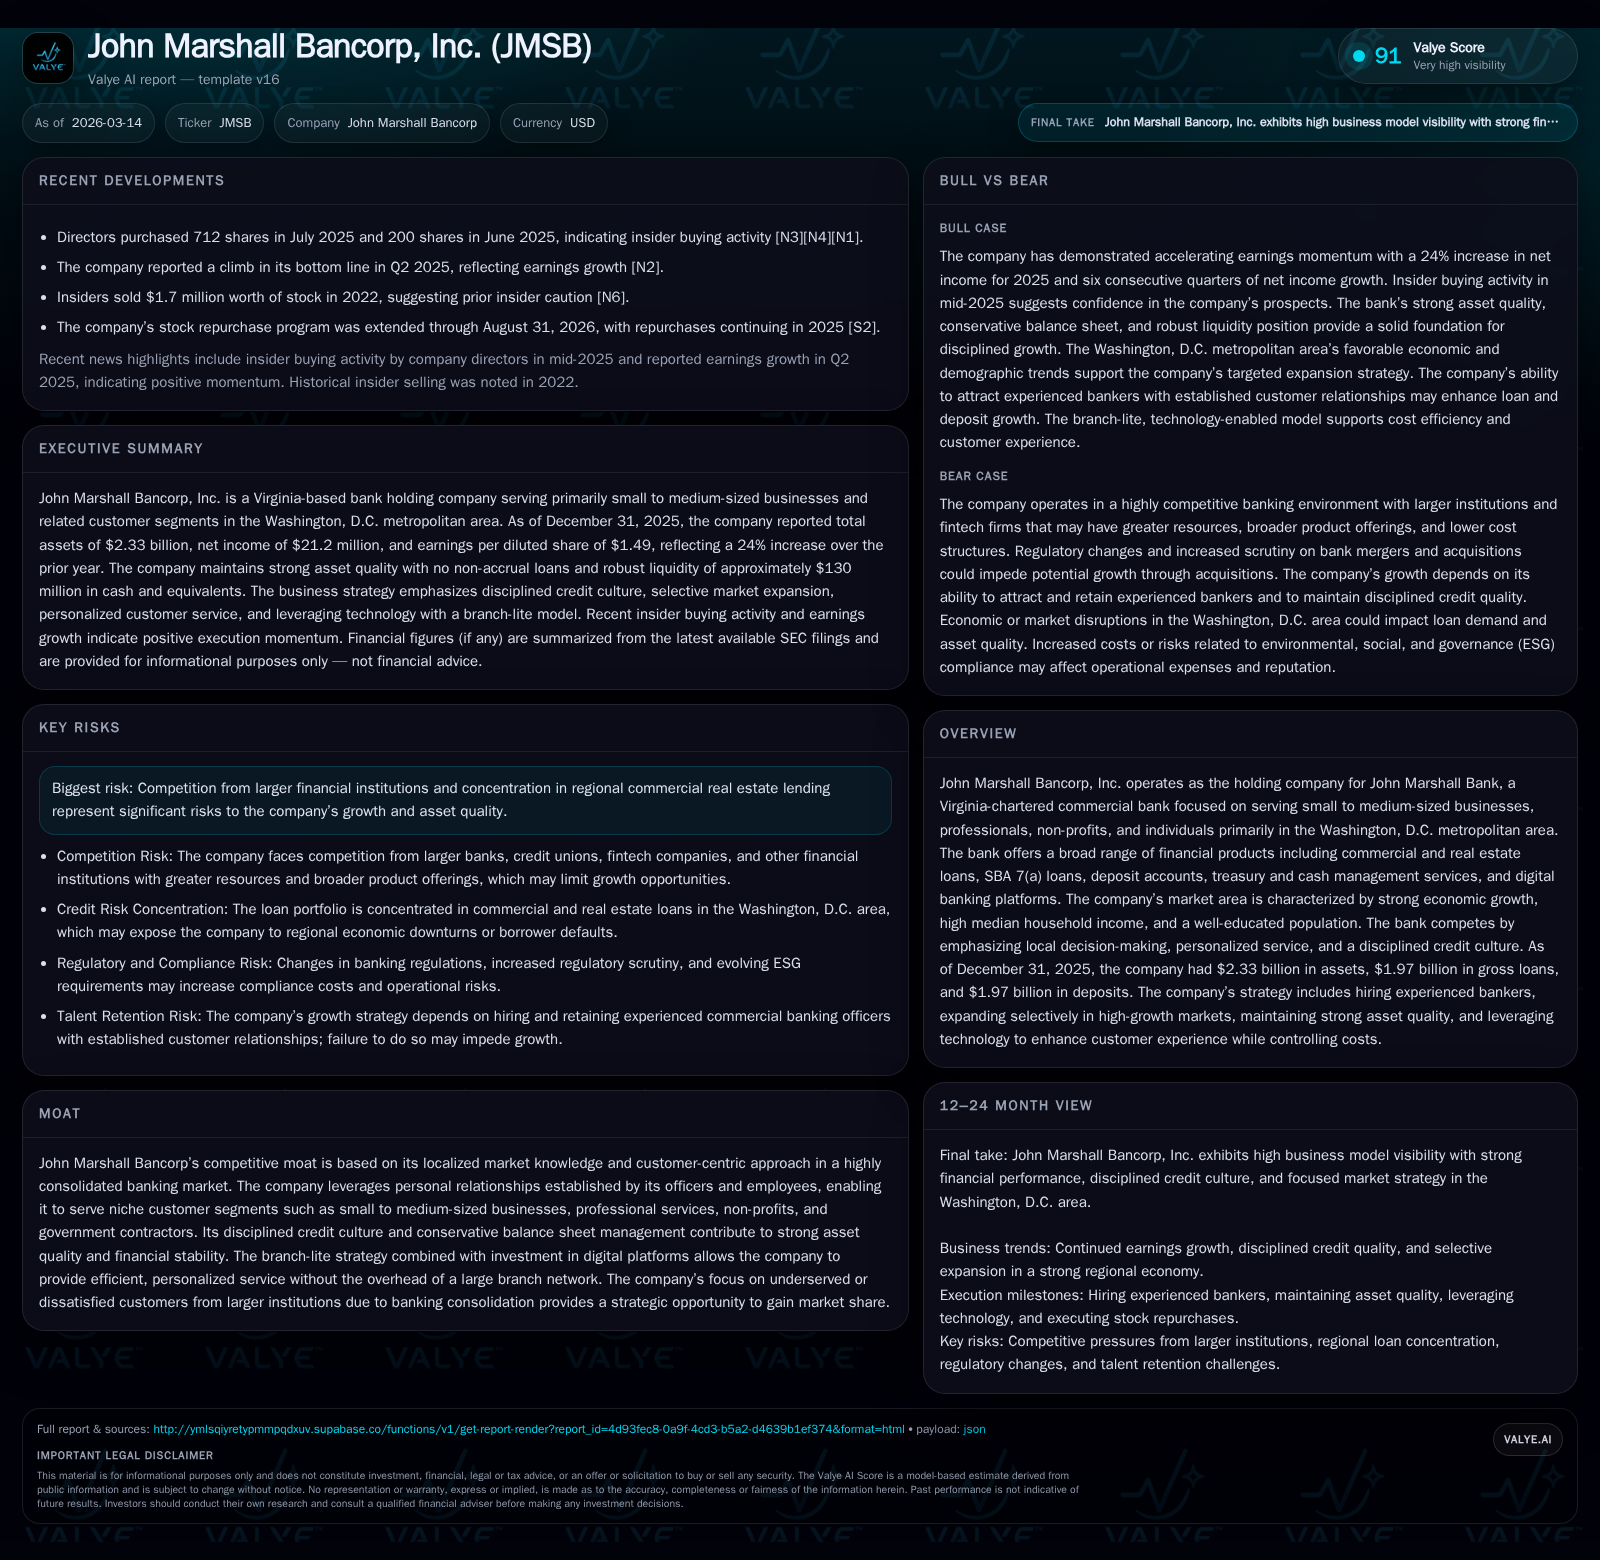
John Marshall Bancorp, a Virginia-chartered commercial bank, has steadily grown its balance sheet and earnings by focusing on small to medium-sized business customers in the Washington, D.C. metropolitan area. Its disciplined credit culture and customer-centric approach have underpinned strong asset quality despite concentration risks in commercial real estate lending. The company maintains a lean branch footprint complemented by digital services, enabling efficient growth and above-peer profitability metrics. Capital returns include dividends and ongoing share repurchases, supported by rising equity and solid cash flow generation. Key factors to watch include its success in expanding market share amid intense regional competition and monitoring credit quality given its portfolio composition.
Company Background and Market Position
John Marshall Bancorp, Inc., founded as a holding company for John Marshall Bank in 2016, operates primarily in the Washington, D.C. metropolitan market—a region characterized by robust economic growth, high median household income ($123K+ projected in 2025), strong educational attainment (55% bachelor’s degree or higher), and steady population expansion [S1]. The bank serves niche segments including small to medium-sized businesses, professional service firms, nonprofits, government contractors, and individuals.
Its competitive moat is grounded in deep local market knowledge coupled with a customer-centric approach that contrasts with larger institution inefficiencies caused by consolidation of the banking sector here . The bank’s 'branch-lite' model complements technology platforms such as online/mobile banking and advanced treasury services to efficiently deliver personalized solutions.
Historical Financial Performance
John Marshall Bancorp has demonstrated consistent growth over recent years as reflected by key financial metrics [F1]. Total assets stood at $2.33 billion at December 31, 2025 with gross loans and deposits each approximately $1.97 billion [S1]. Net income improved significantly by around 24% year-over-year to $21.2 million driven mainly by loan portfolio growth and controlled operating expenses.
The following table summarizes relevant financial figures for FY2022-FY2025:
Historical performance (annual)
| FY | Net ($mm) | CFO ($mm) | Capex ($) | Net YoY |
|---|---|---|---|---|
| 2025 | 21 | 23 | 554000 | +24.0% |
| 2024 | 17 | 17 | 483000 | +231.9% |
| 2023 | 5 | 18 | 612000 | -83.8% |
| 2022 | 32 | 33 | 156000 |
Source: SEC companyfacts cache [F1].
Capital returns and efficiency (annual)
| FY | Div ($mm) | Buybacks ($mm) | FCF ($mm) |
|---|---|---|---|
| 2025 | 4 | 2 | 22 |
| 2024 | 4 | 0 | 17 |
| 2023 | 3 | 17 | |
| 2022 | 3 | 33 |
Source: SEC companyfacts cache [F1].
Note: Revenue data is not explicitly provided; table focuses on net income and cash measures aligned with disclosures.
Loan Portfolio Composition and Credit Quality
As of December 31, 2025 John Marshall's loan book grew by $103.2 million or roughly +5.5% from prior year [S13][S15]. Growth was led by construction & land development loans (+$57M) and residential mortgage loans. Commercial owner-occupied real estate loans declined but remain the largest category (60% of total loans). Purchased adjustable-rate mortgages account for about ~17% of the portfolio.
The bank adheres to conservative underwriting standards emphasizing cash flow analysis of borrowers along with thorough collateral evaluations [S4][S6]. Notably:
- Collateral monitorings such as borrowing base certificates occur monthly/quarterly.
- Personal guarantees are generally required with ownership interests >20%, especially for commercial loans.
- Interest rates on commercial term loans are mostly floating or fixed for terms not exceeding five years.
Asset quality metrics remain strong with no reported non-accrual loans or owned real estate foreclosures as of December 2025 [S13]. This reflects the benefit of a disciplined credit culture amidst concentrated exposures.
Growth Strategy and Future Prospects
John Marshall Bancorp plans to sustain growth principally via:
- Hiring experienced bankers with established customer relationships targeting specific sub-markets within its primary service areas around Northern Virginia and adjoining counties [S7][S13].
- Selective branch openings anchored by these bankers once a footprint is justified economically.
- Leveraging technology-enabled customer experiences across loan origination and deposit services.
- Opportunistic expansion into similar high-growth regional markets characterized by small-medium business density.
Despite past investigations into acquisitions without completion so far [S13], future M&A remains a possible lever for expansion.
A pivotal driver will be capitalizing on dissatisfaction from customers displaced or underserved due to consolidation trends among major competing banks locally. The bank’s nimble operational model coupled with local decision-making can differentiate its service delivery .
Capital Structure and Returns
Total shareholders’ equity increased approximately $19 million or +7.7% year-over-year reaching nearly $266 million at end-2025 [F1][S11]. This translated into an approximate return on equity (ROE) around 8%, consistent with reported average ROAE near peer benchmarks [S13].
Operating cash flow grew nearly +31% YoY to $22.6 million whereas capital expenditures stayed low at just over half a million dollars annually [F1], resulting in free cash flow near $22 million—indicating efficient conversion of earnings into liquid resources.
Dividend payments also increased to approximately $4.27 million in fiscal year 2025 with accompanying stock repurchases totaling about $2.42 million executed under an ongoing repurchase plan originally authorized in August 2021 and extended through August 2026 [S2][S11][F1]. This active capital return program supports shareholder value alongside balance sheet strength.
Risk Factors
Several material risks could impact future performance:
- Intense competition from larger regional banks limits pricing power and new client acquisition potential [S8].
- The heavy concentration in commercial real estate lending exposes the bank to sector downturns or borrower defaults that could deteriorate asset quality rapidly given potentially correlated collateral values across borrowers [S10][S25].
- Regulatory risks including evolving consumer protection statutes enforced by agencies like CFPB increase compliance costs and risk of penalties if missteps occur [S8][S19][S23]. Additionally cybersecurity threats are an ongoing concern given reliance on digital platforms though no material events have occurred yet [S14].
- Changes in monetary policy directly affect net interest margins since substantial portions of loans carry floating rates or short-term resets.
- Concentrated exposure geographically within the Washington D.C. MSA creates vulnerability to localized economic shifts despite demographic strengths [S6][S13].
The company proactively monitors liquidity stress scenarios quarterly and maintains sizable secured borrowing capacity via Federal Home Loan Bank lines amounting to over $450 million plus other credit facilities providing ample funding flexibility even under market stress conditions [S11][S21].
Industry Context Analysis
Regional community banks like John Marshall must navigate a cliquish competitive landscape dominated by megabanks wielding scale advantages yet often lacking tailored service capabilities that local enterprises prize. In this environment:
- Branch-lite models bolstered by robust digital experience are increasingly critical for cost control while retaining intimacy.
- Rigorous credit discipline offers insulation against cyclical real estate risk spikes common in metro regions where property prices correlate tightly across segments.
- Talent acquisition focused on bankers embedded within target sub-markets aligns sales efforts better than generic national strategies deployed by competitors.
Maintaining consistent profitability metrics above peer averages through prudent underwriting and cost-conscious infrastructure investment is widely recognized as hallmark discipline among successful mid-sized banks operating within major metropolitan corridors today.
What to Watch Going Forward (Analysis)
While explicit management guidance beyond the latest annual report is limited:
- Monitor quarterly loan portfolio mix shifts especially around residential versus commercial loan balances.
- Track any announced branch expansions or banker hires indicative of tangible inroads into new geographies or industry verticals.
- Watch sustained net interest margin trends amidst fluctuating Fed rate regimes impacting floating-rate lending yields vs deposit costs.
- Observe capital return policies adapting to profitability changes; accelerations or pauses in repurchases/dividends signal confidence levels.
- Remain vigilant regarding regulatory developments notably CFPB rules affecting consumer data sharing/open banking compliance scheduled for rollout from April 2029 onwards impacting operations ultimately [S19].
Conclusion
John Marshall Bancorp presents a compelling case study in balancing steady organic growth driven by strong local relationships against inherent risks posed by concentrated real estate portfolios amid a consolidating regional banking market. Its disciplined underwriting combined with lean operational leverage enables it to deliver shareholder returns while maintaining conservative liquidity buffers. However future results hinge critically on sustained economic vitality within its geographic markets coupled with effective risk management navigating evolving regulatory landscapes.
This analysis is based solely on publicly available information as of March 14th, 2026 including SEC filings referenced herein ([F1],[S#]) without proprietary insight or forward-looking statements beyond explicit disclosures.
Disclaimer: This is research-only, informational analysis and not investment advice. It may include AI-generated interpretation and general industry context. Always verify important details using primary sources.
Comments