
Kennametal Accelerates Growth with Strategic Restructuring and Pricing Power
In fiscal 2026, Kennametal significantly advanced its growth and profitability through effective restructuring, pricing strategies, and market diversification.
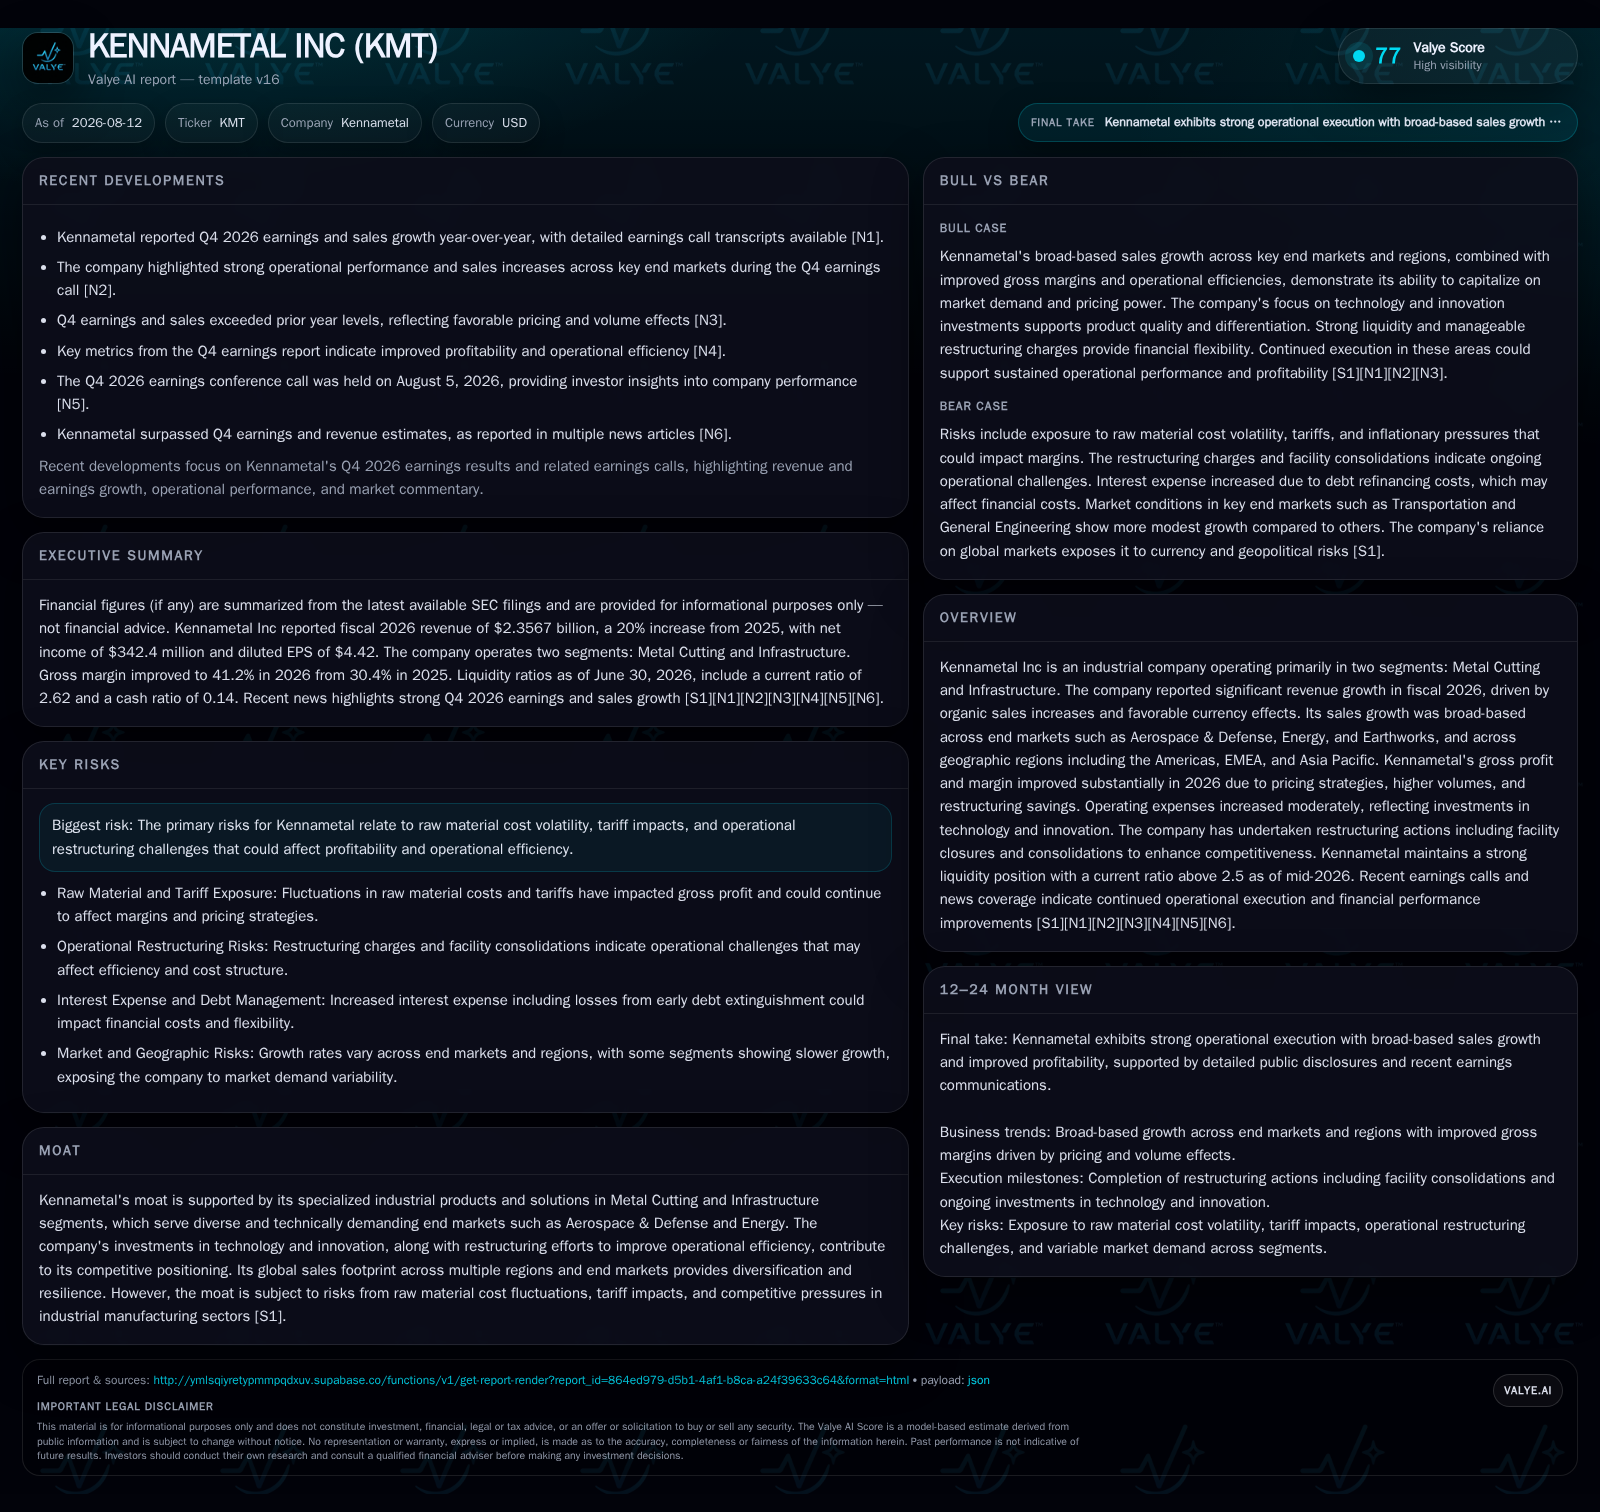
Kennametal Inc reported a robust 20% revenue increase in fiscal 2026 driven mainly by organic sales growth of 19% and favorable currency effects. This growth spanned key end markets including Aerospace & Defense, Energy, and Earthworks across Americas, EMEA, and Asia Pacific. The company improved gross margin to 41.2%, helped by pricing power amid raw material volatility and restructuring savings, despite rising operating expenses due to targeted R&D investments. Kennametal’s strategic facility consolidations and cost control initiatives underpin its enhanced competitive positioning within the industrial tools sector.
Fiscal 2026 Breakthrough: How Recent Operational Moves Propel Growth
Kennametal’s fiscal year ended June 2026 marked a clear inflection point characterized by accelerated organic sales growth of 19%, contributing to total revenue of $2.357 billion—up 20% year-over-year including currency tailwinds [S1]. This solid performance builds on significant restructuring actions initiated in early 2025 that substantially improved competitiveness through facility closures in Greenfield, MA, and consolidation efforts in Barcelona, Spain [S1], [S8]. While restructuring charges of $11.4 million persisted into fiscal 2026, the company benefited from incremental recurring annual savings exceeding $24 million. The interplay of these operational improvements sets a foundation for sustainable margin expansion amid evolving raw material cost dynamics.
Diverse Customer Base and Geographies Power Broad-Based Sales Momentum
Kennametal’s broad exposure across diverse end markets explains its resilient top-line trajectory. Aerospace & Defense grew sales by over 30%, Energy by roughly the same magnitude, while Earthworks expanded nearly 40%—segments that typically require specialized metal cutting tools and infrastructure components designed for demanding industrial applications [S1]. General Engineering and Transportation grew at more modest rates yet contribute to overall portfolio breadth.
Geographically, Americas led growth with a ~25% increase by reported metrics (28% constant currency), supported by strong OEM demand and aftermarket parts penetration. EMEA’s growth was moderate but steady at 14% (7% constant currency), while Asia Pacific attained a healthy ~15%, emphasizing the company’s balanced regional footprint [S1]. This diversified customer mix is critical for managing cyclicality endemic in capital-intensive sectors like aerospace and energy.
Margin Expansion Drivers: Pricing Strategies Meet Rationalized Cost Structure
Kennametal’s gross profit jumped over $370 million to $970 million in FY26, boosting gross margin from a relatively subdued 30.4% in the prior year to an impressive 41.2% [S1]. This swing reflects multiple drivers: notably, the favorable timing difference between raw material-related pricing adjustments versus input costs contributed roughly $316 million in margin benefit—a pattern consistent with effective pass-through pricing tied closely to commodity price cycles.
Additionally, non-raw material related pricing initiatives and selective tariff surcharges within the Metal Cutting segment bolstered revenue quality. Rising production volumes further leveraged fixed costs while restructuring savings incrementally reduced the cost base [S1]. Offsetting these were inflationary pressures on compensation costs, tariff-related expense increases outside of surcharges, and reduced insurance proceeds in Infrastructure operations—highlighting ongoing external headwinds faced even amid operational progress.
Operating expenses increased by about $48 million or 11%, primarily reflecting continued investments in technology innovation crucial for maintaining competitive differentiation [S1]. Research & development expenses remained stable around $43 million signaling Kennametal's commitment to advancing precision machining capabilities and wear-resistant materials used extensively by OEM customers worldwide
Navigating Raw Material Volatility: Pricing and Restructuring as Hedge
The industrial tools manufacturing sector is historically sensitive to raw material price swings that affect margin volatility unless adequately managed through pricing discipline or supply chain strategies. Kennametal demonstrated adeptness here by implementing dynamic pricing actions that closely track input cost trends including tariffs imposed in global trade environments [S1]. While some tariff impact raised expense levels temporarily, corresponding surcharge mechanisms enabled recovery of these costs without diluting margin profile.
Further mitigating input cost risks are recent structural moves such as facility consolidations completed by mid-2025 which rationalized capacity footprints reducing overhead burdens especially amid softer market conditions encountered earlier [S8]. These efforts combine both tactical cost takeout with strategic positioning allowing agile scaling aligned to demand shifts.
Innovation Investment Balances Efficiency with Competitive Differentiation
Kennametal’s R&D spending stability around $43 million annually evidences a deliberate balance between operational efficiency gains via restructuring and safeguarding technological leadership essential for sustaining its moat [S1]. Innovations focus on advanced metal cutting tools employing proprietary wear-resistant materials tailored for high-precision manufacturing in aerospace components or infrastructure equipment parts.
Such continuous product development underpins pricing power enabling premium realization relative to commoditized toolmakers within peer ranks. This technical edge also supports deeper integration into customer workflows spanning OEM supply chains as well as aftermarket parts markets where repeat purchase rates serve as durable revenue streams.
Competitive Benchmarking: Kennametal Versus Industrial Peers
Moreover, peers like Fastenal focusing on distribution highlight varied exposure profiles; Kennametal benefits from product specialization requiring engineering expertise commanding higher margins than general industrial distributors, reinforcing competitive positioning anchored in complex product design manufacturing.
Constraints Ahead: Raw Material Risks and Cyclicality Watchpoints
Looking forward, primary risks include continued volatility in raw material prices that could outpace pricing adjustments if supply chain disruptions or geopolitical tensions intensify [S1]. Tariff policies globally remain uncertain variables influencing both cost inputs and cross-border customer demand dynamics
Furthermore, cyclicality within end markets such as aerospace—driven by defense budgets or commercial transport fleet renewals—and energy sector investments remains unpredictable especially amid ongoing energy transition trends impacting demand compositions. Monitoring order backlog depth by segment or observed utilization rates will be critical indicators of cyclical recovery or softness ahead.
Forward Signals: Key Milestones and Metrics to Monitor
Validating sustained growth requires close attention to key operating indicators such as sequential organic sales progression within core segments (Aerospace & Defense, Energy), shifts in regional revenue mixes particularly EMEA given weaker currency-adjusted gains last cycle, along with margin sustainability metrics reflecting cost pass-through effectiveness.
Order backlog status combined with capacity utilization rates at principal manufacturing facilities will provide early insight into demand strength versus potential overcapacity risk following restructurings.
Financial Profile Discussion: Liquidity Strength Supports Growth Strategy
As of June 30, 2026, Kennametal holds cash and equivalents of approximately $95.8 million against current liabilities near $677 million resulting in a strong current ratio around 2.62 indicating solid near-term liquidity coverage [F1]. Total debt stands at about $685 million with net debt approximating $589 million after cash offsets—a moderate leverage posture compatible with capital-intensive manufacturing businesses focused on operational flexibility [F1].
All figures are referenced explicitly from SEC filings or approved data sources herein without speculative extrapolation.
Disclaimer: This is research-only, informational analysis and not investment advice. It may include AI-generated interpretation and general industry context. Always verify important details using primary sources.

Comments