
LENNAR Corp's FY2025 Financial Review: Revenue Decline Amid Operating Income Growth and Capital Allocation Focus
LENNAR’s FY2025 results reveal a revenue decline alongside improved operating profitability, reflecting strategic cost management in a challenging housing market environment.
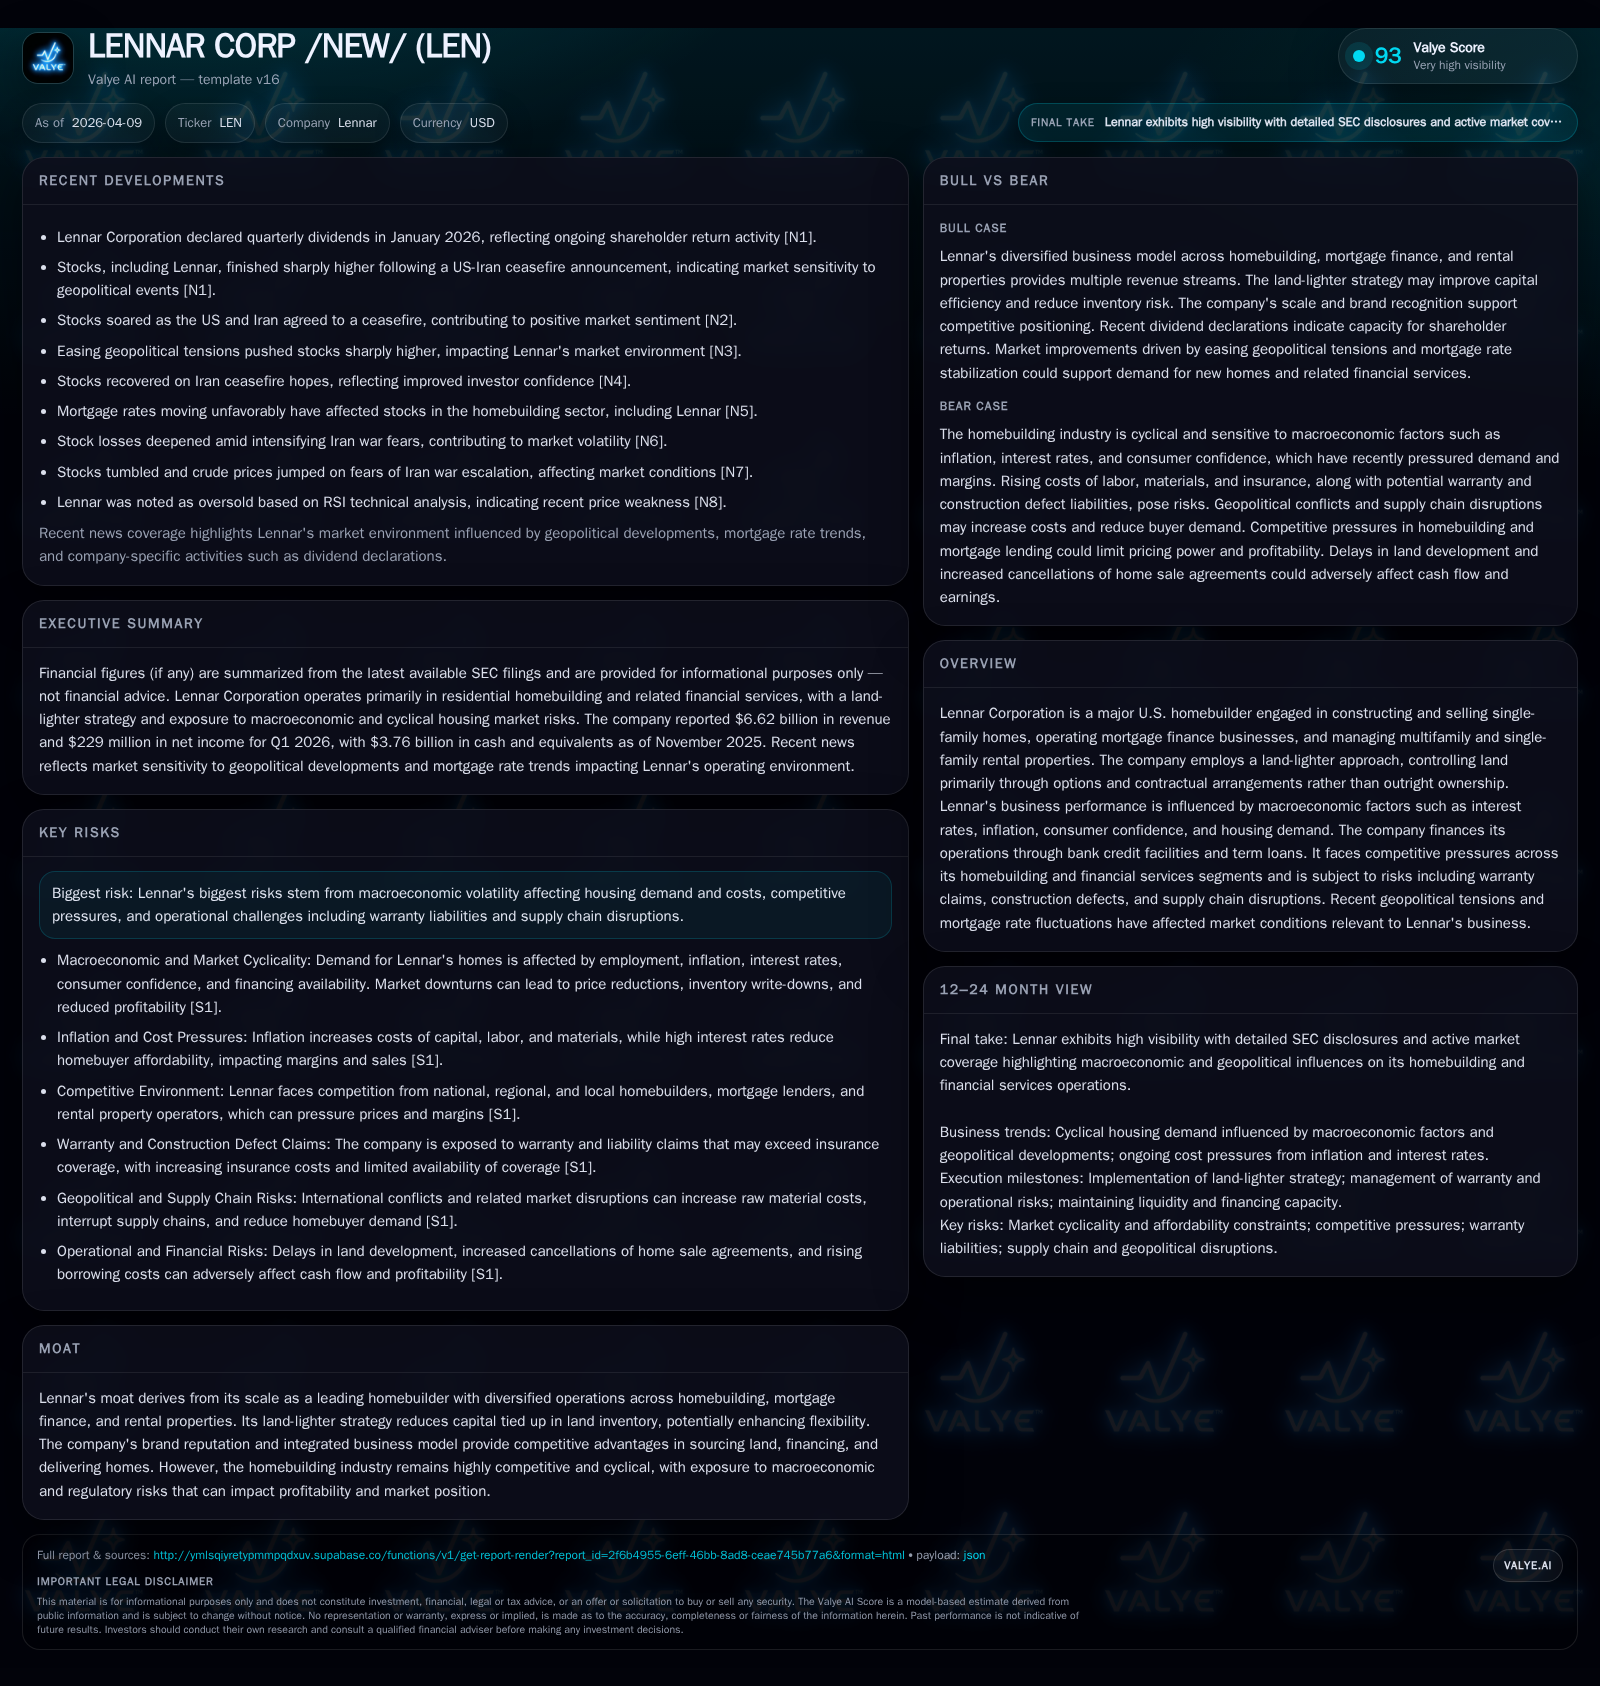
Lennar Corporation reported FY2025 revenue of $34.2 billion, down 3.5% year-over-year, while operating income increased 25.5%, demonstrating margin resilience amid soft demand and inflationary pressures. Net income declined 47%, driven by factors beyond operating profit. Operating cash flow compressed sharply due to higher inventories and land option deposits consistent with its land-lighter strategy. The company maintains a strong liquidity position and conservative leverage well within covenant limits. Capital allocation priorities remain evident through dividends totaling $521 million and share repurchases of $1.8 billion. Market dynamics, including mortgage rates and land contract exposures, will be critical to monitor for future performance.
FY2025 Financial Performance Overview
Lennar Corporation’s fiscal year 2025 results show a nuanced financial profile with top-line softness contrasted by improved operating profitability. Revenue declined 3.5% year-over-year from approximately $35.4 billion in FY2024 to $34.2 billion in FY2025 [F1]. This decrease aligns with industry-wide challenges including elevated mortgage rates that have dampened new homebuyer affordability [S1].
Operating income grew significantly by approximately 25.5%, evidencing disciplined cost controls and operational efficiencies that helped offset pricing pressure and inflationary cost increases [F1],[S1]. Despite this operating improvement, net income declined nearly 47%, reflecting impacts from financing costs, taxes, or other non-operational factors [F1].
Operating cash flow contracted sharply by about 91% to $217 million due primarily to working capital effects such as inventory build-up and increased deposits linked to Lennar's land-lighter approach [F1],[S10]. Capital expenditures rose modestly by 10% to $189 million, consistent with ongoing investments in strategic growth initiatives [F1].
Historical performance (annual)
| FY | Rev ($bn) | Net ($bn) | CFO ($bn) | Capex ($mm) | Rev YoY | Net YoY |
|---|---|---|---|---|---|---|
| 2025 | 34.2 | 2.1 | 0.2 | 189 | -3.5% | -47.2% |
| 2024 | 35.4 | 3.9 | 2.4 | 172 | +3.5% | -0.2% |
| 2023 | 34.2 | 3.9 | 5.2 | 100 | -14.6% | |
| 2022 | 4.6 | 3.3 | 57 |
Source: SEC companyfacts cache [F1].
Capital returns and efficiency (annual)
| FY | Div ($mm) | Buybacks ($bn) | FCF ($bn) |
|---|---|---|---|
| 2025 | 521 | 1.8 | 0.0 |
| 2024 | 549 | 2.3 | 2.2 |
| 2023 | 431 | 1.2 | 5.1 |
| 2022 | 438 | 1.0 | 3.2 |
Source: SEC companyfacts cache [F1].
Source: SEC filings and company facts [F1], [S1], [S10]
Macroeconomic Influences on Demand and Margins
The company highlights that demand for new homes is sensitive to macroeconomic factors such as employment levels, inflation, mortgage interest rates, consumer confidence, and financing availability [S1]. Elevated mortgage rates have notably reduced buyer purchasing power during fiscal years 2024-25, pressuring sales volumes [N5],[S1]. Inflation impacts costs across labor, materials, and energy inputs, compressing margins as Lennar cannot fully pass through price increases under current demand conditions [S1]. Additionally, tariffs and trade policies contribute further cost uncertainties.
Supply chain disruptions remain a risk factor affecting construction schedules and cost predictability [S26]. Consumer confidence is also influenced by geopolitical events; however, recent easing following US-Iran ceasefire announcements has bolstered market sentiment temporarily . Despite positive geopolitical developments, fundamental housing affordability challenges persist.
Land-Lighter Strategy: Capital Efficiency with Contractual Risk
Lennar’s land-lighter model emphasizes controlling future development sites primarily through options or contractual arrangements rather than outright land ownership [S1]. This strategy conserves capital tied up in static land assets while allowing flexibility in inventory management.
However, this approach entails substantial non-refundable option deposits—reported at approximately $6.3 billion—and letters of credit used in lieu of cash deposits under certain contracts [S16],[S20],[S22]. These commitments pose financial risks if market downturns necessitate non-exercise or renegotiation of options leading to potential impairments.
While this model reduces upfront land acquisition risk, it requires rigorous underwriting discipline given the exposure to contractual obligations during cyclical downturns [S1],[S22]. The elevated levels of deposits contributed significantly to working capital outflows affecting operating cash flow in FY2025 [F1],[S10].
Capital Structure and Liquidity Position
Lennar maintains a conservative homebuilding debt-to-total capital ratio of approximately 7.4%, significantly below the maximum covenant limit of 60%, indicating robust leverage management [S4],[F1]. Liquidity coverage is strong with liquidity levels exceeding interest expense requirements by roughly fifty-six times as of November 30, 2025 [S4].
The company holds access to committed revolving credit facilities totaling over $3.1 billion plus Delayed Draw Term Loan Facility borrowings near $1.7 billion supporting both corporate needs and strategic land acquisitions/options [S5],[S21].
Financial Services segment utilizes warehouse facilities aggregating several billion dollars in commitments for residential mortgage loan financing; renewal depends on prevailing market conditions [S8],[S25]. Senior notes outstanding total approximately $2.1 billion; refinancing risks are acknowledged but current financial structure shows no immediate distress signs amidst rising interest rates [S6],[S11].[F1]
Shareholder Returns: Dividends and Buybacks
Despite challenging earnings dynamics, Lennar prioritizes shareholder returns with dividends paid totaling $521 million in FY2025, maintaining consistency from prior years [F1],[S7],[S14]. Share repurchases amounted to approximately $1.8 billion during the same period—a reduction from prior year levels reflecting tighter cash flow conditions yet demonstrating ongoing capital return commitment [F1].
Total equity decreased notably from the prior year due largely to spin-offs (e.g., Millrose), share repurchases, and net income variation contributing to an approximate ROE near 9.5%, indicating moderate profitability relative to equity base size [F1].
Forward-Looking Considerations
Management has not provided formal earnings guidance post latest filings; however key metrics for monitoring include mortgage interest rate movements impacting buyer affordability and absorption rates for new homes [S2],[N5]. The maturity profile of land option contracts warrants attention given their material off-balance-sheet nature influencing future inventory valuations and potential impairments [S16],[S22].
Geopolitical easing such as the US-Iran ceasefire has provided short-term positive sentiment but fundamental constraints related to housing affordability remain dominant factors shaping demand recovery prospects.
Lennar’s ability to balance cyclical headwinds with its integrated business model scale advantages while maintaining prudent leverage and selective capital deployment will be critical in defining medium-term growth trajectories.
This analysis is based exclusively on Lennar Corporation’s SEC filings as of April 2026 alongside cited publicly available news sources; it does not constitute investment advice or recommendations.
Disclaimer: This is research-only, informational analysis and not investment advice. It may include AI-generated interpretation and general industry context. Always verify important details using primary sources.
Comments