
Ligand Pharmaceuticals' Transformation: From Volatile Returns to Sustained Profitability
Ligand shifted from prior losses to strong net income growth by leveraging diversified royalties and strategic capital management.
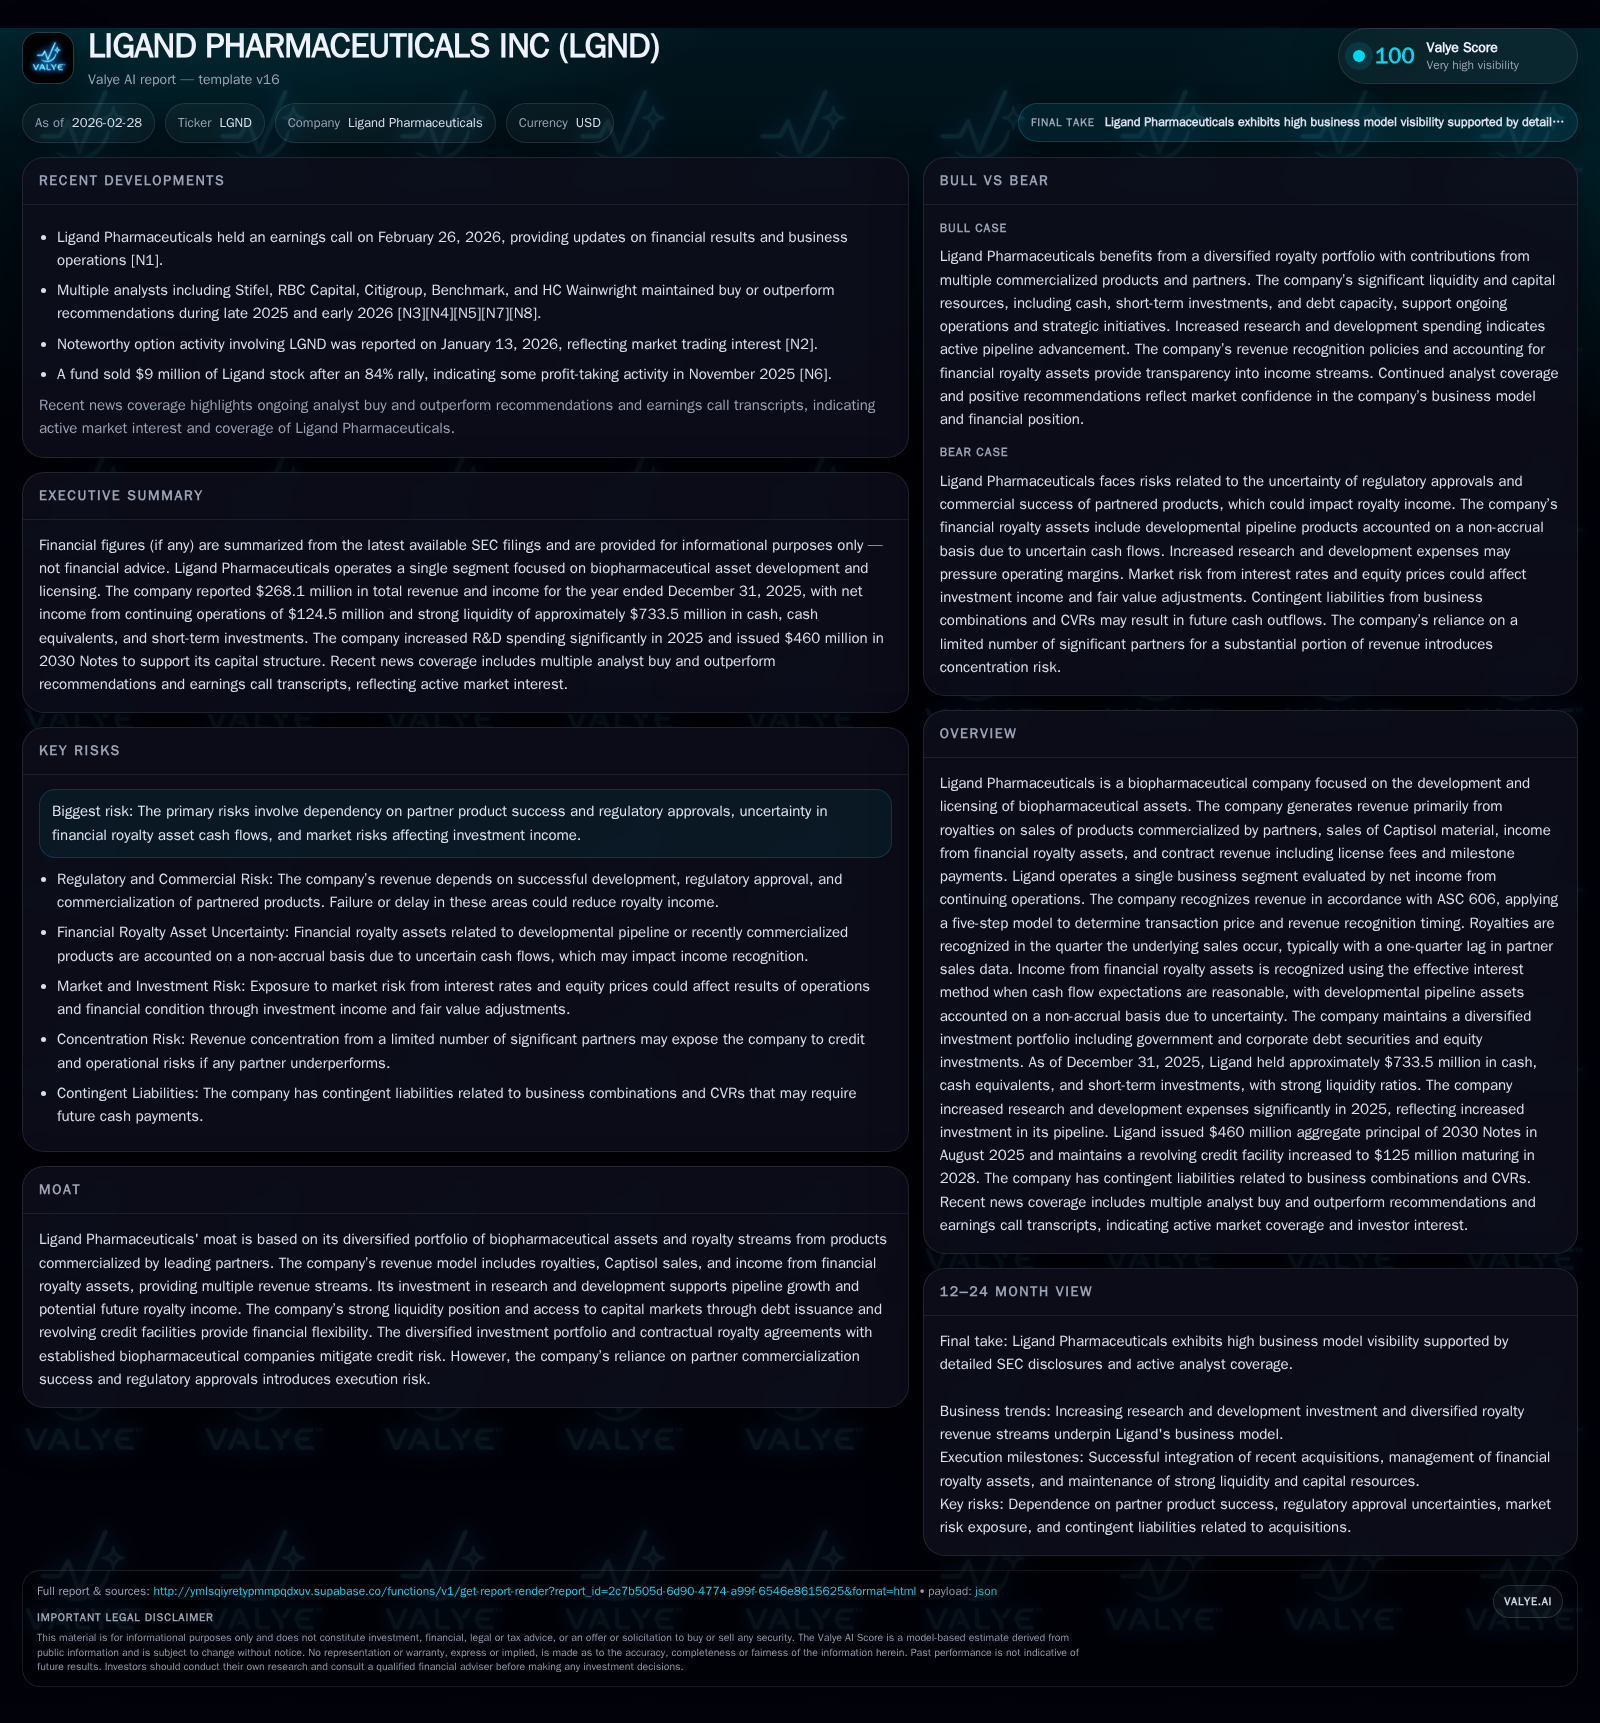
Ligand Pharmaceuticals marked a significant turnaround in fiscal year 2025, posting a net income of $124.5 million after a loss in 2024. This shift was powered by higher royalty revenues, robust gains from financial royalty assets and equity investments, as well as disciplined capital and debt management. Despite reduced operating cash flow and cautious capital expenditures, the company’s liquidity soared, supported by an expanded revolving credit facility and a convertible note issuance. Ligand’s diversified royalty streams and strategic financing position it well for sustained profitability, although future growth remains tied closely to partner product success and regulatory outcomes.
Historical Performance: Exiting the Loss Zone
Ligand Pharmaceuticals demonstrated a pronounced financial turnaround during fiscal year 2025 compared to its prior performance. Total revenue climbed sharply by 32.2%, rising from approximately $203 million in 2024 to $268 million in 2025 [F1][S1]. Operating income reversed its prior negative position—transforming from a loss of about $22.6 million in 2024 into a positive operating income of $41 million in 2025 [F1]. This swing reflects effective operational enhancements alongside robust royalty revenue streams.
Net income from continuing operations surged from a modest loss of $4 million in 2024 to a substantial gain of $124.5 million in 2025—a growth exceeding 3000% [F1][S1]. The effective tax rate normalized to 22% in 2025 from an elevated and volatile 260% in the preceding year due to discrete tax items [S1][S22]. Operating cash flows decreased by nearly half—from about $97 million down to roughly $49.4 million—chiefly affected by timing changes but nonetheless remained positive after a dramatic reduction in capital expenditures from $1.8 million down to just under half a million dollars [F1]. This writing-down of capex highlights tightening focus on cost efficiency while maintaining necessary asset support.
This financial progression underscores Ligand’s ability to transition out of volatile returns toward sustainable profitability anchored by multiple revenue sources and capital efficiencies.
Revenue Drivers and Royalty Stream Diversification
Ligand’s business model revolves around generating multiple revenue streams including royalties on partnered pharmaceutical products, sales of Captisol material—a cyclodextrin used for drug solubilization—and income from acquired financial royalty assets encompassing milestone payments and licensing fees [S1][N1]. This broad-based approach reduces concentration risk inherent with dependence on single assets.
The company recognizes royalties based on products commercialized by leading pharmaceutical partners such as Amgen, Merck, Jazz Pharmaceuticals, Recordati, and Sanofi [S12]. Captisol sales originate mainly through contract manufacturing agreements with Hovione, which supplies the material exclusively under capacity arrangements that also include embedded finance leases representing productive asset use rights [S16][S26].
Contract revenues additionally include license fees and milestone payments tied to regulatory and sales milestones achieved collaboratively with partners [S11][N1]. The timing and recognition follow ASC Topic 606 standards ensuring revenues align with performance obligations; royalties are recognized upon receipt with typical quarter lag reporting from partners [S1].
This diversification provides steady top-line growth buffers against variability stemming from clinical or regulatory events affecting any single drug candidate or partner program.
Financial Asset Gains and Investment Volatility Impact
A key driver behind the explosive jump in Ligand’s net income was the escalation of non-operating income. Total non-operating income jumped fourfold from approximately $25 million to nearly $118 million year-over-year [S1][F1], largely fueled by fair value appreciation of equity method investments—including shares related to Pelthos common stock acquired during recent transactions—and mark-to-market gains on publicly traded securities like Viking common stock.
While gains from short-term investments fell (due principally to no Viking shares sold in the current period compared to prior realized gains), appreciation on equity investments totaling roughly $90.7 million more than offset these reductions [S1]. These investment portfolio movements introduced earnings volatility but contributed substantially to Ligand’s profitability resurgence.
Interest income also rose appreciably reflecting larger average investment balances held throughout the year, partially offset by increased interest expense arising from a new convertible note issuance with amortization of associated debt issuance costs factored into interest expense recognition [S1][S7].
Other non-operating expenses decreased significantly due to diminished derivative-based losses recorded previously, underscoring improved financial instrument management [S1]. The interplay between core royalties-driven operations versus fluctuating investment returns underscores the nuanced nature of Ligand’s earnings analysis.
R&D and Pipeline Outlook: Risks and Opportunities
Though Ligand primarily operates as a licensing entity rather than direct commercial manufacturer, its commitment to research development underpins long-term pipeline expansion and future royalty income streams [N1][S11][S17]. Investments focus on early-stage biopharmaceutical assets with potential for partnering or licensing post-approval.
However, this strategy involves inherent pipeline risk since drug candidates require successful clinical trials and regulatory approvals before commercial viability—and thus affect timing and magnitude of royalties received. Partner dependency compounds execution risks; Ligand relies heavily on third parties for commercialization success without direct control over marketing or sales strategies [S29].
Regulatory uncertainty further adds complication given the complex approval landscape in biopharma sectors where approval delays or denials can create meaningful volatility in anticipated cash flows [S12]. Ligand discloses these factors transparently within their risk assessments emphasizing market risks impacting royalties alongside credit exposures connected to counterparties involved in royalty payments [S12][N1].
Capital Structure Evolution and Liquidity Strength
Ligand enhanced its financial flexibility during the period through several noteworthy capital structure maneuvers including expansions to its revolving credit facility first initiated at $75 million then amended upward to $125 million during mid-2024, extending its maturity out to September 2028 [S4][S5][S6]. This robust liquidity buffer remains largely undrawn (approximately $124.4 million available) positioning the company well to fund working capital needs or opportunistic strategic pursuits without undue leverage strain.
In August 2025, Ligand issued $460 million aggregate principal amount of convertible senior notes due 2030 featuring low coupon rates (~0.75%) supplemented by convertible note hedge transactions aimed at reducing dilutive effects upon conversion for shareholders [S7]. These sophisticated hedging structures reflect advanced capital management tactics often seen among seasoned biotech firms seeking capital at favorable terms while preserving shareholder value integrity.
The indenture and credit facilities contain customary covenants including minimum EBITDA requirements ($55 million trailing four quarters) which Ligand comfortably met without event-of-default conditions as noted at fiscal year end [S15][S19]. Conservative use of leverage combined with sizeable liquid assets—including cash plus short-term marketable securities approximating over $733 million—increases operational resilience amid potential sector headwinds [F1][S19][S22].
Capital Allocation Priorities: Repurchases, Debt, and Dividends
Regarding shareholder return policies, Ligand adopted a pragmatic stance balancing fiscal discipline with selective buybacks aligned with strategic priorities. In August 2025 concurrent with convertible note issuance proceeds receipt, the company repurchased about $15 million worth of shares at an average price near $147 per share—demonstrating opportunistic deployment without excessive scale given outstanding authorization remains [$50M] through April 2026 unused as per disclosures [S8][F1].
Ligand maintained suspension on dividends consistent with earlier years retaining earnings predominantly for reinvestment or liquidity preservation rather than payout distribution [S8]. Additionally, no shares were issued under At-The-Market Equity Offering Programs during fiscal 2025 as the shelf registration expired prior year, signifying containment of equity dilution risks [S8][S13].
Return on Equity approximated 12.2%, reflecting healthy profits relative to expanded equity base indicating efficient capital utilization despite conservative repurchase activity scale compared against financial magnitude [F1]. This allocation approach corresponds well with typical growth-stage biopharma licensing companies prioritizing pipeline maturation alongside solid balance sheet management.
Key Metrics and Financial Health Snapshot
Historical performance (annual)
| FY | Net ($mm) | CFO ($mm) | OpInc ($mm) | Capex ($mm) | Net YoY |
|---|---|---|---|---|---|
| 2025 | 124 | 49 | 41 | 0 | +3186.6% |
| 2024 | -4 | 97 | -23 | 2 | -107.7% |
| 2023 | 52 | 50 | 12 | 4 | +398.3% |
| 2022 | -17 | 138 | 3 | 18 |
Source: SEC companyfacts cache [F1].
Capital returns and efficiency (annual)
| FY | Buybacks ($mm) | FCF ($mm) | ROE% |
|---|---|---|---|
| 2025 | 15 | 49 | 12.2 |
| 2024 | 95 | -0.5 | |
| 2023 | 46 | 7.4 | |
| 2022 | 0 | 120 | -2.9 |
Source: SEC companyfacts cache [F1].
*Values for FY2025 derived directly from latest XBRL filing data; YoY comparisons computed where feasible using reported underlying figures.[F1]
Liquidity measured by current ratio stood at an exceptionally strong ~22x reflecting large current assets relative to liabilities reinforcing robust short-term financial health.[F1]
Outlook and Analyst Focus: Monitoring Catalysts and Constraints
Although explicit numeric guidance is absent from public disclosures for forthcoming periods,[N1][S2] several key catalyzers merit scrutiny given their potential impact on Ligand’s trajectory:
- Continued ramp-up or renewal milestones arising from partner agreements contribute incremental license revenue streams.
- Launches or expanded commercial success of partnered products underpin subsequent royalty accruals essential for top-line sustainability.
- Potential pipeline approvals remain highly uncertain yet represent latent upside contingent on regulatory outcomes well understood within biopharma contract licensing frameworks.[N1][S11]
- Market fluctuations affecting equity securities valuations possess immediate influence over reported non-operating results but not core operating cash flows.
- Credit risk management around counterparty solvency especially concerning largest payors such as Recordati requires constant vigilance.[S12]
Careful monitoring of quarterly royalty revenue trends alongside R&D progress metrics will inform expectations regarding sustainable profit generation capacity amid evolving industry conditions.
This analysis is based solely on public filings including SEC reports dated February 27th, 2026 ([S#]) and recent earnings call transcripts ([N#]), supplemented with companyfacts ([F1]) data snapshots through FY2025 as provided. No forward-looking advice or recommendations are intended herein.
Disclaimer: This is research-only, informational analysis and not investment advice. It may include AI-generated interpretation and general industry context. Always verify important details using primary sources.
Comments