
Cheniere Energy’s Expansion and Capital Strategy Drive Earnings Surge Despite Market Volatility
Cheniere Energy leverages large-scale U.S. LNG infrastructure and disciplined capital allocation to sustain growth and enhance returns.
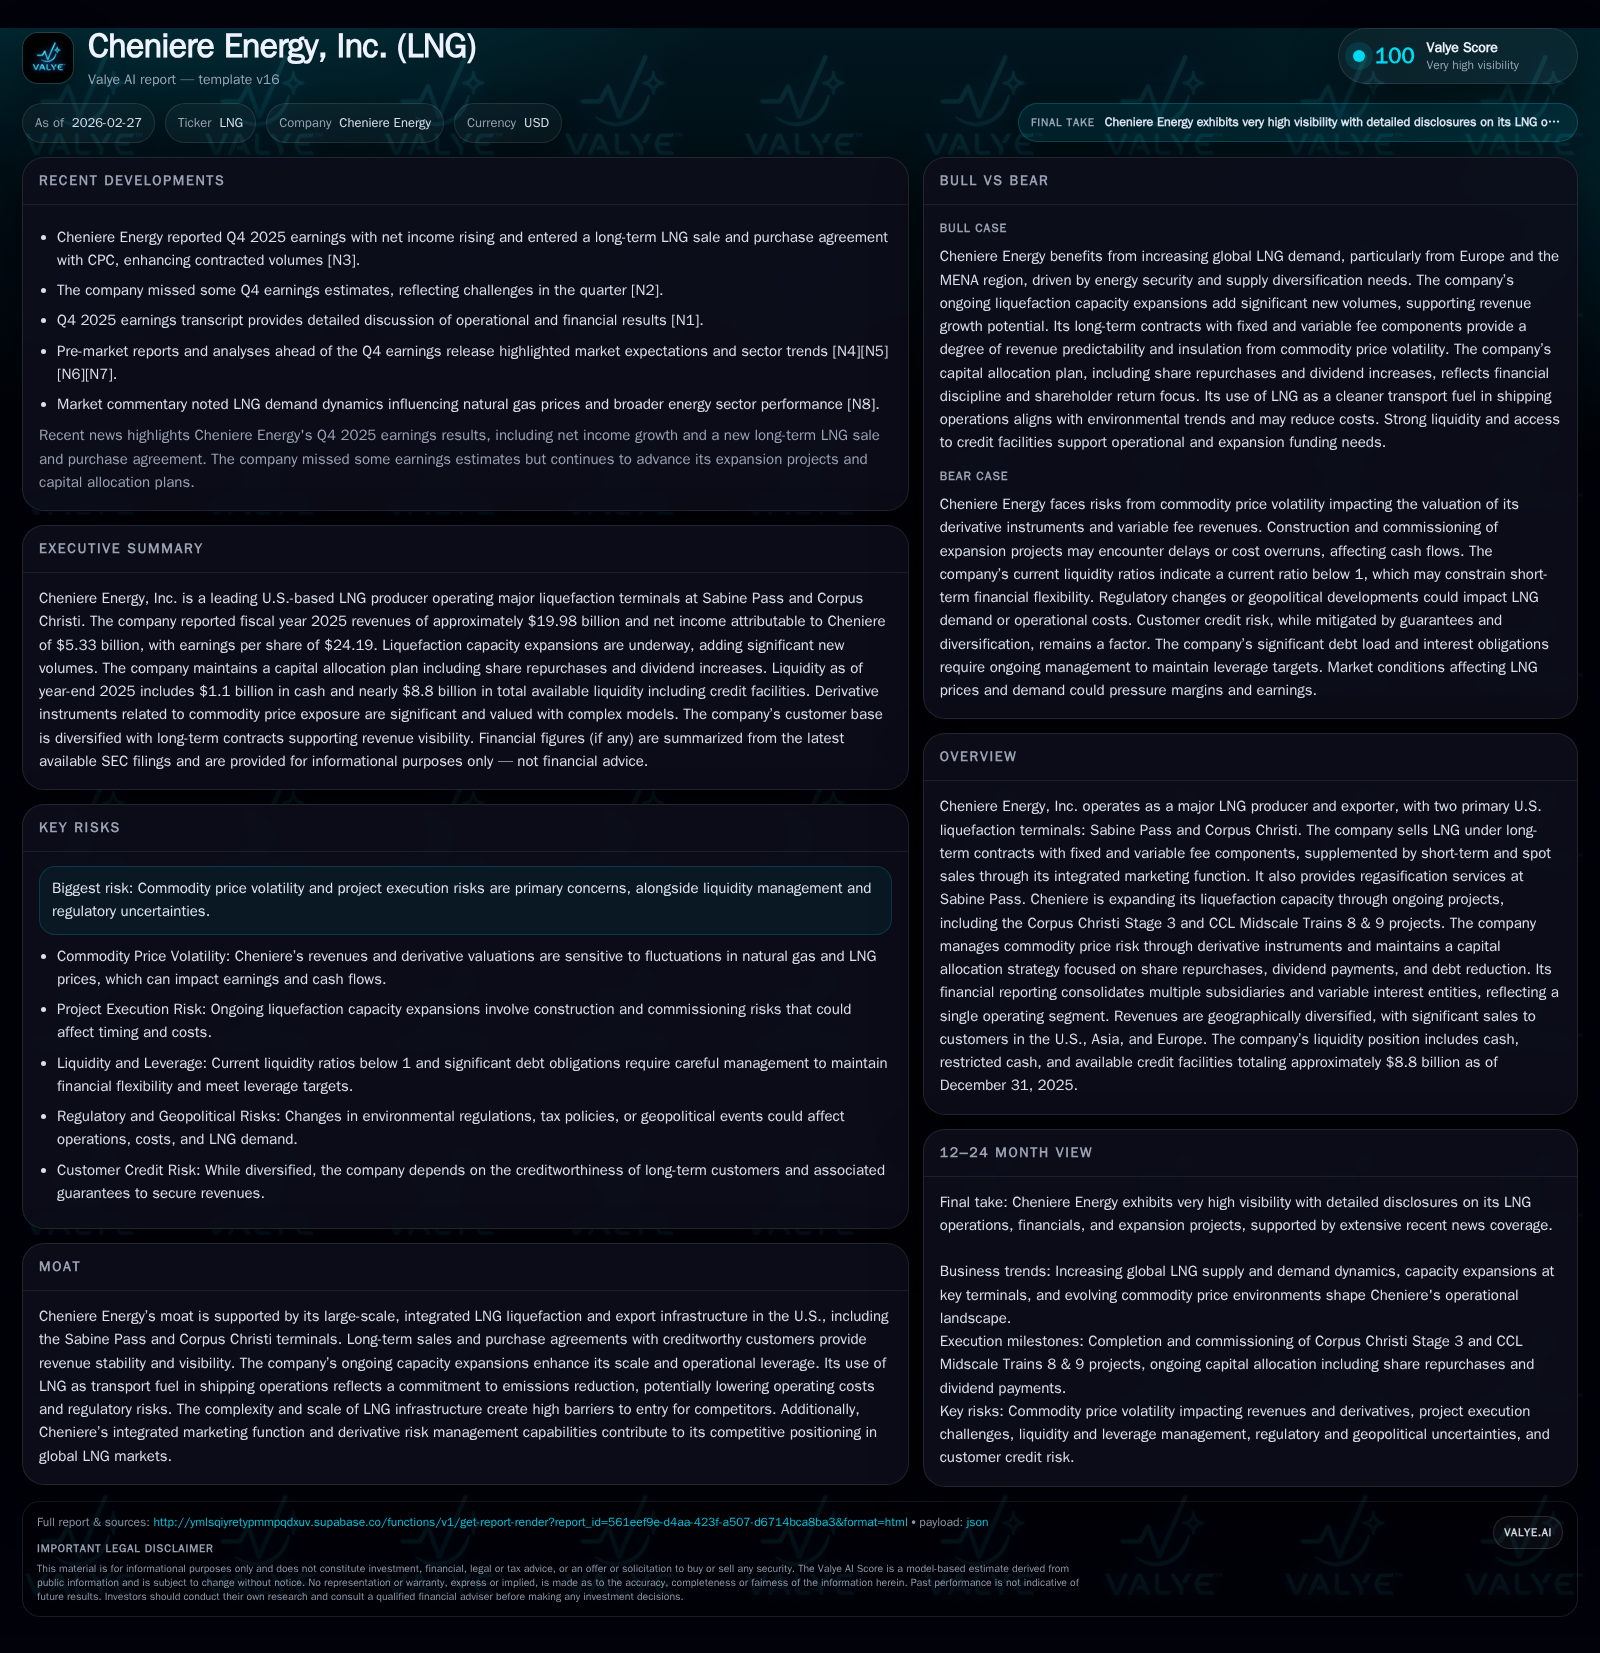
Cheniere Energy's fiscal 2025 performance demonstrated strong top-line recovery and margin expansion supported by integrated LNG operations. Substantial capacity additions from Corpus Christi and Sabine Pass projects underpin future revenues, while a disciplined capital allocation plan emphasizes substantial share repurchases, dividends, and targeted debt reduction. Execution risks and commodity price volatility remain key considerations, but the company's infrastructure scale, long-term contracts, and risk management efforts provide resilience in a complex LNG market environment.
Historical Financial Performance
Cheniere Energy reported significant recovery in its financial metrics for fiscal year (FY) 2025, rebounding from softer market conditions observed in FY2024. Total revenues improved markedly to approximately $20.0 billion in 2025, a 27% increase year-over-year from $15.7 billion in 2024 [F1]. Nonetheless, this remains below the peak revenue of $33.4 billion recorded in FY2022 under exceptional market conditions.
Operating income rose substantially to $9.11 billion (+48.7% YoY), paralleling the revenue increase while also benefiting from greater operational efficiency tied to expanded liquefaction volumes at its terminals [F1]. Net income advanced sharply by nearly 64% to $5.33 billion as effective cost control and favorable contract pricing contributed to profitability gains.
Operating cash flows (CFO) were stable at roughly $5.54 billion despite the company stepping up capital investment into expansion projects, underscoring strong underlying cash generation capabilities [F1]. The increasing scale from new capacity offsets pressures from elevated capex outlays.
Annual Financial Summary
Historical performance (annual)
| FY | Rev ($bn) | Net ($bn) | CFO ($bn) | OpInc ($bn) | Rev YoY | Net YoY |
|---|---|---|---|---|---|---|
| 2025 | 20.0 | 5.3 | 5.5 | 9.1 | +27.2% | +63.9% |
| 2024 | 15.7 | 3.3 | 5.4 | 6.1 | -23.0% | -67.1% |
| 2023 | 20.4 | 9.9 | 8.4 | 15.5 | -39.0% | +591.9% |
| 2022 | 33.4 | 1.4 | 10.5 | 4.6 |
Source: SEC companyfacts cache [F1].
Capital returns and efficiency (annual)
| FY | Div ($mm) | Buybacks ($bn) | FCF ($bn) |
|---|---|---|---|
| 2025 | 451 | 2.7 | 2.5 |
| 2024 | 412 | 2.3 | 3.2 |
| 2023 | 393 | 1.5 | 6.3 |
| 2022 | 349 | 1.4 | 8.7 |
Source: SEC companyfacts cache [F1].
Table reflects consolidated financials per company filings [F1].
Growth Drivers and Future Prospects
Cheniere operates two flagship U.S.-based liquefaction terminals at Sabine Pass (Louisiana) and Corpus Christi (Texas), underpinning its competitive moat via scale and integrated infrastructure [S20]. The first four trains of the Corpus Christi Stage 3 Project achieved substantial completion sequentially across March through December 2025, adding meaningful liquefaction capacity [S4]. Alongside this, the CCL Midscale Trains 8 & 9 project commenced full construction after board-level final investment decisions (FID) in mid-2025 with combined expected additional peak production capacity exceeding nine million tonnes per annum (mtpa) once all trains are operational [S4][S16].
These expansions cumulatively add over fifteen mtpa of liquefaction capacity when all are online—including debottlenecking enhancements—expected to contribute incremental LNG volumes that will initially be sold on short-term or spot markets by Cheniere’s integrated marketing arm until corresponding long-term sales purchase agreements (SPAs) commence [S4]. This exposes the company to short-term price volatility during ramp-up phases but is offset by SPAs that provide fixed fees plus variable components linked partly to Henry Hub natural gas benchmark prices, which limit Cheniere’s net exposure to gas cost fluctuations under its feedgas supply arrangements [S25][S26].
Additionally, Cheniere completed acquisition of full control over the Gregory Power Plant adjacent to its Corpus Christi terminal early in 2026; this enhances risk management capabilities vis-à-vis power supply demands associated with ongoing expansions but necessitates further liquidity injections for operations and upgrades [S1][S16].
Looking forward, Cheniere filed for additional phased expansions—namely the SPL Expansion Project (Sabine Pass site) targeting about twenty mtpa—and a separate application for the CCL Expansion Project encompassing four more trains at Corpus Christi with up to twenty-four mtpa peak capacity envisioned pending regulatory approvals and financing arrangements [S15][S17]. These potential projects underscore a pipeline for disciplined but sizable growth depending on final investment decisions.
Capital Allocation & Returns
Cheniere exhibits a capital allocation policy balancing growth investments alongside shareholder returns and financial prudence.
In calendar year 2025, the company ramped up capital spending significantly (+37%) investing approximately $3.08 billion mostly directed towards EPC contracts for Stage 3 Corpus Christi expansion and CCL Midscale project trains under Bechtel lump sum turnkey agreements that transfer substantial cost overrun risks to contractors barring change orders [S16][F1].
Simultaneously, Cheniere aggressively reduced leverage with targeted indebtedness repayments totaling around $700 million during the year aiming for a long-term leverage target near four times adjusted EBITDA sets the tone for conservative balance sheet management amidst capital-intensive expansion phases [S8]. As of December 31, 2025, total senior notes outstanding stood at almost $23 billion with weighted average interest rates moderately low (~4.65%), supplemented by multiple revolving credit facilities offering about $7+ billion available liquidity under covenant-compliant terms providing financial flexibility near term [S10][S19][F1].
Shareholder returns improved meaningfully alongside earnings growth: dividends increased by over ten percent in mid-2025 elevating annualized dividends per share above $2 while repurchases soared to $2.7 billion encompassing approximately twelve million shares retired during the year at a weighted average price above $220—an indication of management’s confidence in underlying free cash flow generation and valuation discipline [F1][S8][N10].
Free cash flow, defined as operating cash flow less capital expenditures, approximated $2.46 billion in FY25 reflecting cushion after funding substantial growth outlays confirming sustainability of return policies even during major expansion activity [F1].
Operational Resilience and Risk Profile
Cheniere maintains risk mitigation measures including natural gas feedstock procurement under long-term contracts securing significant supply into future years along with firm pipeline transportation rights supporting reliable fuel supply for liquefaction operations [S25]. Additionally, integration of LNG-fueled vessels reduces emissions relative to conventional marine fuels aligning with regulatory shifts while capturing federal alternative fuel excise tax credits historically though terminated end-2024; recent IRS confirmation should trigger recognition of related gains approximating $370 million soon thereby easing cost pressures [S1].
The company also employs derivative strategies on commodity prices and foreign exchange exposures intending to stabilize earnings variability from volatile global energy markets although fair value adjustments led to sizable noncash mark-to-market gains/losses impacting reported results notably across recent periods [S26][S20].
Legal exposures are largely immaterial; notably ongoing compliance issues concerning formaldehyde emissions at Sabine Pass appear well managed with no material penalties anticipated following cooperation with authorities culminating in meeting all regulatory milestones as of late-2025 [S24][S1].
Forecasts & Key Monitoring Points (Analysis)
While explicit multi-year guidance beyond near-term announcements is limited in public disclosures, key indicators for future performance include timing of successful completion and ramp-up throughput from Stage 3 and Midscale trains, achievement of positive FID on SPL Expansion Project phases and CCL Expansion incremental trains, as well as ability to secure long-term SPAs underpinning new volumes replacing initially spot-sold output.
Monitoring natural gas price trends relative to Henry Hub benchmarks is vital since contract variable fees track these inputs albeit capped by total fixed charges secured under IPM agreements partially offsetting feedgas fuel margin exposures.
Watch liquidity trends closely given elevated capex plans balanced against aggressive debt reduction aims; credit facility availability alongside covenant compliance will be crucial markers.
Share repurchase activity pacing will indicate management conviction regarding valuation versus growth reinvestment opportunities while dividends offer insight into sustainable free cash flow yields amid cyclical energy market swings.
Conclusion
Cheniere Energy stands as a leading U.S.-based LNG liquefaction operator leveraging scale advantages concentrated around Sabine Pass and Corpus Christi hubs supported by lengthy contracted sales volumes aligned with sophisticated risk management frameworks poised to capitalize on ensuing global LNG demand dynamics. Its recent financial turnaround evidences successful navigation through prior years’ market headwinds aided by rapid expansion execution bolstered by a focused capital allocation strategy aimed at enhancing shareholder value via dividend growth and accretive buybacks. Nonetheless, vigilance towards project execution risks inherent in multi-billion-dollar expansions alongside commodity price cyclicality remains imperative. This positions Cheniere well for continued operational growth combined with disciplined financial stewardship as it pursues emerging opportunities within an energy transition-conscious market landscape.
Disclaimer: This analysis is prepared solely for informational purposes without any investment recommendation or advice concerning securities or financial instruments described herein.
Disclaimer: This is research-only, informational analysis and not investment advice. It may include AI-generated interpretation and general industry context. Always verify important details using primary sources.
Comments