
Manhattan Bridge Capital Inc. Charts Path Amid Shifting Real Estate Lending Dynamics
Manhattan Bridge Capital leverages its specialized hard money lending expertise to navigate competitive pressures and evolving regional market conditions.
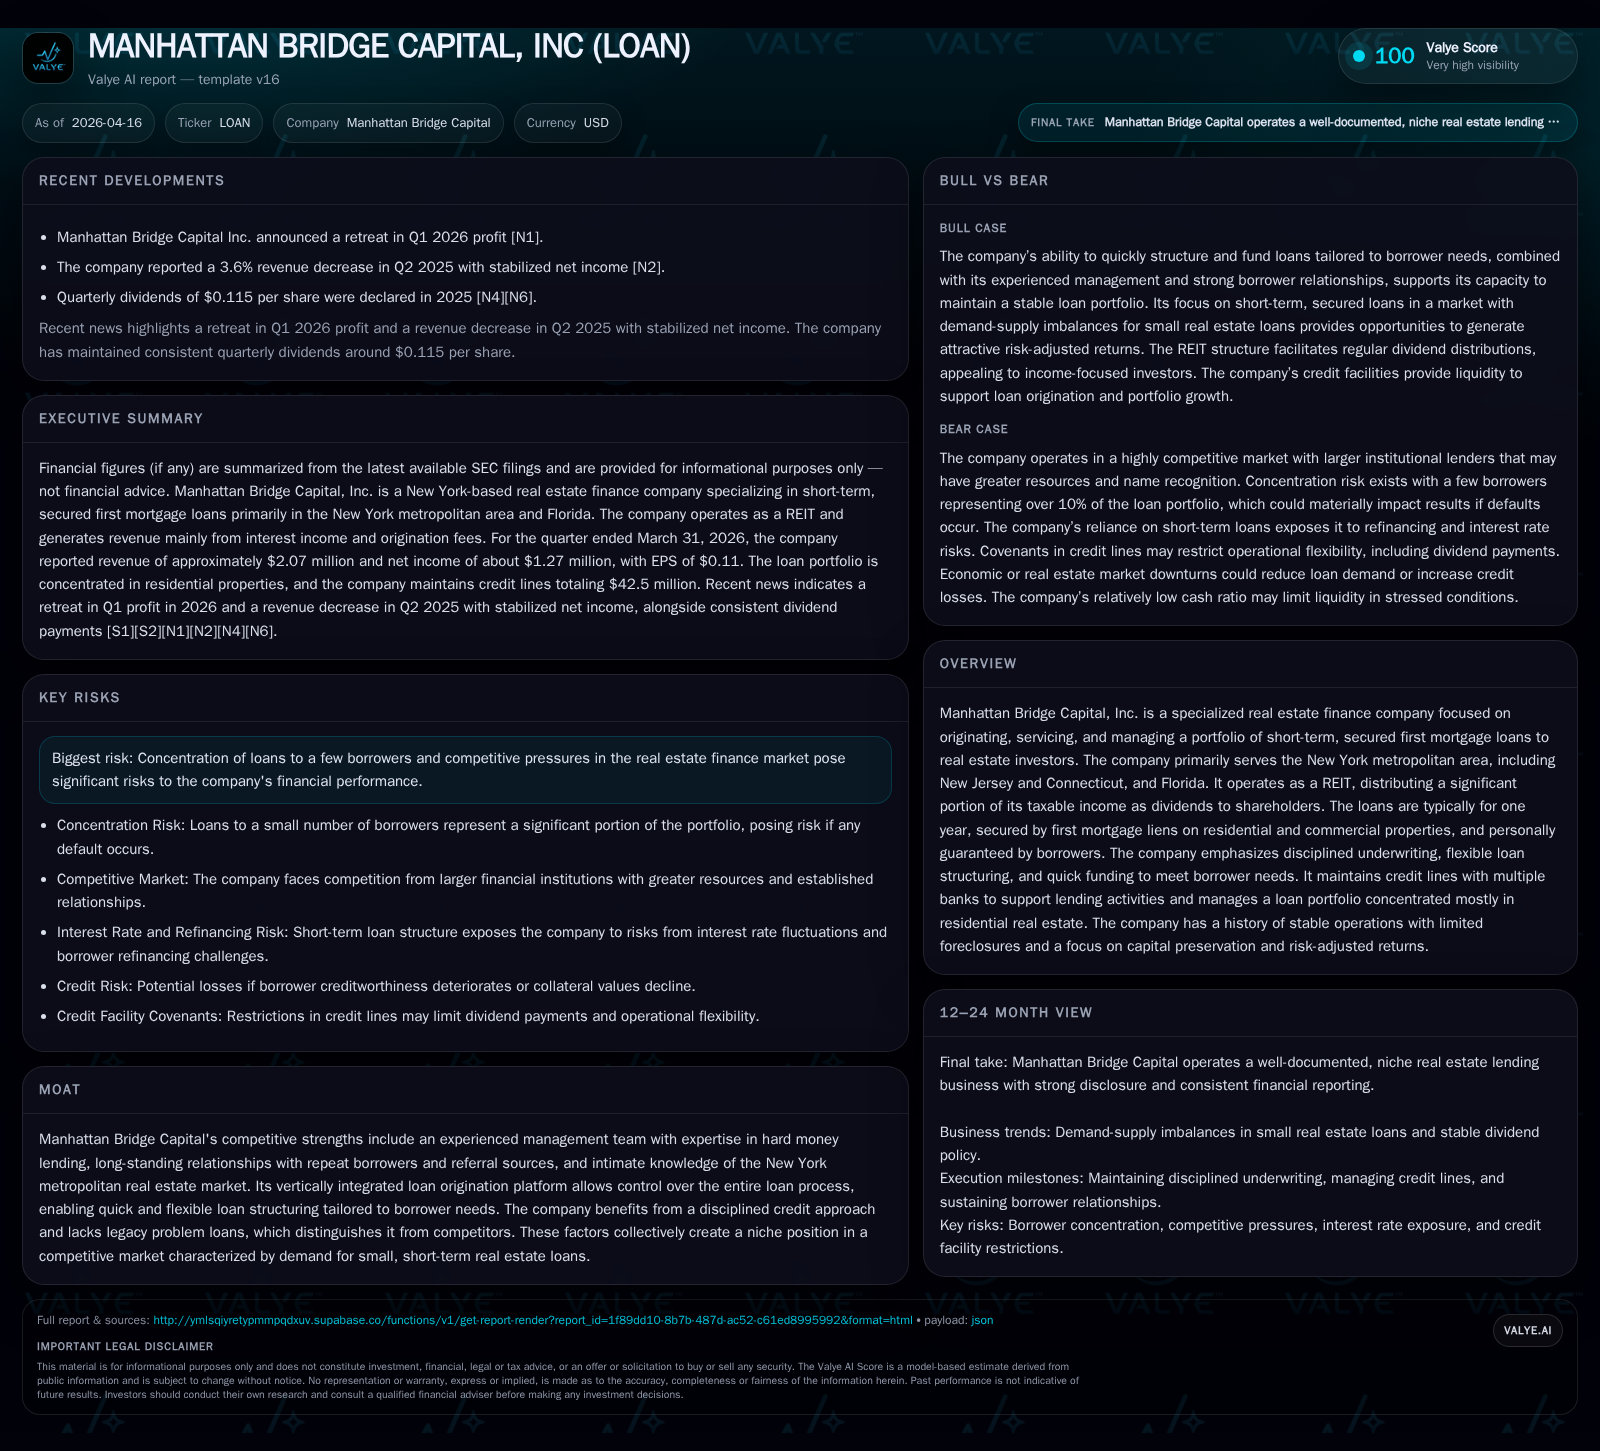
Manhattan Bridge Capital, Inc. operates as a niche real estate finance company focusing on short-term, secured first mortgage loans mainly in the New York metropolitan area with recent expansion into New Jersey, Connecticut, and Florida. The company’s historical growth from 2022 to 2024 was robust but slowed in 2025 amid tighter lending conditions and competitive headwinds, reflected in a revenue decline of over 10%. Its underwriting discipline and flexible loan structuring underpin stability despite borrower concentration risks and elevated interest rates impacting financing costs. Recent Q1 2026 results showed profit retreat amid liquidity management efforts relying on credit lines, while dividend policies remain aligned with REIT distribution mandates.
Legacy of Growth: Revenue, Profit Trends, and Underwriting Discipline
Manhattan Bridge Capital’s growth trajectory from fiscal year 2022 through 2024 showcased expansion underpinned by its specialty focus on short-term first mortgage loans. Revenue climbed from approximately $8.57 million in FY2022 to near $9.80 million in FY2023 before slightly tapering to $9.69 million in FY2024 [F1]. This progression reflects stable demand for hard money loans within their core real estate investor clientele.
However, FY2025 marked a reversal with revenues declining about 10.6% to roughly $8.67 million [F1]. Operating income followed a similar pattern falling by nearly 8.6% versus prior year to $5.09 million. Net income also declined concomitantly by about 8.6%, ending the year at approximately $5.11 million [F1]. Operating cash flow remained steady around $4.93 million despite capex cutting sharply by nearly 90%, reflecting prudent cost control during slower loan origination activity.
Disciplined underwriting remains at the core of Manhattan Bridge’s credit culture as evidenced by extensive borrower due diligence practices involving property valuations, lien searches, and personal guarantees [S1]. This rigor shields the lender from legacy problem loans that often plague competitors reliant on less stringent standards.
Historical performance (annual)
| FY | Rev ($mm) | Net ($mm) | CFO ($mm) | OpInc ($mm) | Rev YoY | Net YoY |
|---|---|---|---|---|---|---|
| 2025 | 9 | 5 | 5 | 5 | -10.6% | -8.6% |
| 2024 | 10 | 6 | 5 | 6 | -1.1% | +2.1% |
| 2023 | 10 | 5 | 6 | 5 | +14.3% | +5.1% |
| 2022 | 9 | 5 | 5 | 5 |
Source: SEC companyfacts cache [F1].
Capital returns and efficiency (annual)
| FY | Div ($mm) | FCF ($mm) | ROE% |
|---|---|---|---|
| 2025 | 5 | 5 | 11.9 |
| 2024 | 5 | 5 | 12.9 |
| 2023 | 5 | 6 | 12.8 |
| 2022 | 6 | 5 | 12.2 |
Source: SEC companyfacts cache [F1].
Table: Manhattan Bridge Capital Annual Financial Overview (Source: [F1])
Loan Portfolio Composition and Geographic Expansion Dynamics
The company's real estate lending portfolio primarily consists of short-term loans secured by first mortgage liens on residential and commercial properties across its core operational footprint: New York metropolitan area (inclusive of New Jersey and Connecticut) plus Florida [S1][S10][S24]. These loans typically range up to maximum face values of approximately $3.6 million each but average around $689k per loan as of late-2025 data [S10]. Strong emphasis on personal guarantees from borrowers’ principals provides an additional recourse layer beyond collateral.
Expansion into New Jersey and Connecticut remains relatively recent with limited operating history there while Florida serves as a potentially complementary market with distinct economic drivers but competitive challenges from established regional lenders [S4][N1]. The current portfolio consists of roughly 88 active loans at year-end FY2025 down marginally from prior years correlating with tightened credit availability.
Loan composition shows predominance of residential mortgage-backed loans approximating over 85% of interest income generated while commercial segment remains modest yet valuable for diversification purposes [S11]. Short duration—the weighted average term to maturity being just above five months—and adjustable interest rate clauses position the company to respond flexibly to changing market interest rates while maintaining attractive yield profiles [S19].
The geographic concentration introduces vulnerability to localized economic stress given that over 93% of loans are secured by properties principally in the tri-state metro area; an economic downturn there could disproportionately affect the loan quality and repayment timing more so than geographically diversified lenders [S17][S24].
Competitive Positioning in New York and Beyond
Manhattan Bridge Capital's competitive strength lies within its ability to offer "hard money loans"—short-term high-yield loans secured primarily against real estate—with tailored structures addressing specific borrower requirements such as renovation or acquisition funding needs [S4][S13][N1]. Unlike larger institutional competitors who may offer more standardized product suites or demand higher loan-to-value ratios capped conservatively for risk control, the company focuses on flexibility combined with disciplined underwriting practices resulting in fewer legacy defaults and higher renewal rates.
Their nimble origination process enables quick funding turnaround times critical for real estate investors needing rapid access to capital amid market opportunities or distressed acquisition scenarios [S13]. While larger banks or REITs benefit from scale advantages such as cheaper funding costs or cross-selling abilities, the company’s niche specialization offers differentiated customer service recognized regionally.
The low debt-to-equity ratio maintained helps preserve resilience during periods of higher market volatility or tighter liquidity conditions prevalent since interest rate hikes began impacting financing costs industry-wide [S4]. This prudent leverage stance supports competitive pricing without compromising financial stability.
Recent Financial Performance: Q1 Profit Setback and Liquidity Insights
In Q1-2026 earnings announced April 16 reported a decline in net profit attributable largely to reduced loan originations coupled with increased borrowing expenses linked to higher SOFR-based interest rates under their credit lines [N1,S2]. Loan volume trends indicated slower deployment contrasting somewhat improved collection efficiency on existing portfolio balances.
Liquidity remains backed by two primary revolving credit facilities: a $32.5 million line with Webster/Flushing Banks renewed through February 28 , 2029 following a recent amendment extending maturity and updating covenants; plus a $10 million facility via Valley Credit Line maturing December 12 , 2027 [S8][S9]. As of March 31 , 2026 outstanding borrowings stood at $13.39 million (Webster Credit Line) and $6.04 million (Valley Credit Line), respectively.
Credit facility covenants impose borrowing limits relative to collateral values and place restrictions on dividend payments or share repurchases when liquidity thresholds are tight—parameters management monitors closely amidst variable interest expense environments [S8][S14]. Management expects existing cash flows combined with undrawn capacity under these lines sufficient for ongoing operations well into the next year notwithstanding planned incremental capital deployment easing loan origination constraints.
Capital Structure and Financing Strategy: Navigating Credit Lines and Leverage
Manhattan Bridge’s capital base is composed predominantly of equity totaling approximately $43 million supported by liabilities dominated by revolving credit lines totaling near $18 million as of end-FY2025 [F1][S7]. The low leverage profile aligns with REIT regulatory frameworks requiring prudential financial metrics alongside steady dividend distributions.
Credit agreements encompass customary protective covenants on loan-to-collateral ratios plus financial ratio maintenance aimed at reducing default risk; however they limit operational flexibility concerning dividends or buybacks during stressed periods [S12][S14]. Amendments increasing credit facility maturities coupled with adjusted portfolio mix rules reflect proactive management addressing both growth ambitions and compliance risks.
Personal guarantees covering potential credit line obligations are provided by CEO Assaf Ran capped at roughly $1 million adding confidence indicators for lenders regarding underlying ownership commitment towards capital structure integrity [S14][S28]. The company strategically avoids excessive indebtedness which mitigates cost volatility given rising rate cycles challenging many mortgage finance businesses currently.
Distribution Policy and Shareholder Returns: Dividends Under the REIT Model
As a taxable real estate investment trust since end-2014 Manhattan Bridge Capital adheres strictly to IRS mandates requiring distribution of at least 90% of REIT taxable income annually to shareholders thereby avoiding corporate level taxation on those earnings [S1][N2]. Dividend payments approximated $5.26 million in FY2025 closely tracking net income levels consistent with this policy framework ensuring high payout ratios typical for mortgage REITs [F1].
Recent ex-dividend notices reaffirmed steady shareholder returns without indication of reduction despite Q1 profit softness mitigated somewhat by operational cash flow stability [N2]. No substantial share repurchase activity has been noted recently beyond modest buybacks initiated during late-2025 primarily serving minor treasury stock adjustments rather than capital return programs [S9].
Risks Rooted in Borrower Concentration and Market Volatility
A significant risk factor detailed extensively relates to borrower concentration where three affiliated entities held more than $6.2 million or roughly one-tenth of the entire loan portfolio principal at December 31 , 2025—a single individual owning majority interests therein underscores risk aggregation potential if adverse repayment events occur simultaneously across those accounts [S10][S11][S25]. Such concentration magnifies vulnerability particularly if local economic stress impacts property values underlying these loans.
Other salient risks identified cover general sensitivity of short-duration hard money loans to extension risks if borrowers seek renewals amid refinancing bottlenecks; fluctuations in collateral valuations affecting LTV cushions; potential slower foreclosure timelines hampering swift loss mitigation; casualty events; plus compliance challenges adhering to REIT status requirements relative to distribution levels and asset composition rules [S15][S16][S20][S23][S26].
Responsiveness combined with conservative underwriting remain crucial mitigants but economic slowdowns or regional recessions around core markets such as NYC vicinity could adversely impact performance disproportionally given lack of broad geographic diversification currently emphasized only incrementally via new state entries [S17][S24][N1].
Outlook and Key Milestones: What to Watch Next
Looking ahead stakeholders should keep close watch on quarterly updates detailing:
- Loan origination volume trends signaling either recovery or further tightening;
- Compliance adherence under amended credit line covenants especially relating to collateral coverage metrics;
- Interest rate environment evolution impacting borrowing costs;
- Portfolio composition shifts notably geographic diversification progress outside the NY tri-state metro;
- Any revisions to dividend policy influenced by earnings variability or regulatory changes affecting REIT qualification;
- Management commentary surrounding competitive positioning adjustments responding dynamically to market pressures.
Given the recent Q1 earnings pullback reflecting transitional challenges balanced against persistent core strengths such as fast turnaround lending capabilities, the company appears intent on cautiously pursuing growth via selective deal origination supported by solid liquidity buffers sourced through its revolving facilities enabling measured scale-up opportunities absent undue leverage risk [N1][S2][S3].
This report compiles publicly available data sources without providing investment advice or recommendations. All numeric information references are based solely on audited financial disclosures ([F1]) or official filings ([S#]) per SEC records or cited news releases ([N#]). Interpretations herein are labeled clearly as analysis without speculative projections beyond documented facts.
Disclaimer: This is research-only, informational analysis and not investment advice. It may include AI-generated interpretation and general industry context. Always verify important details using primary sources.
Comments