
Lam Research Advances with Margin Gains and Strategic Exposure in Semiconductor Growth
Lam Research’s Q3 fiscal 2026 results reveal operational efficiencies and expanding customer support, underpinning its competitive stance amid semiconductor industry dynamics.
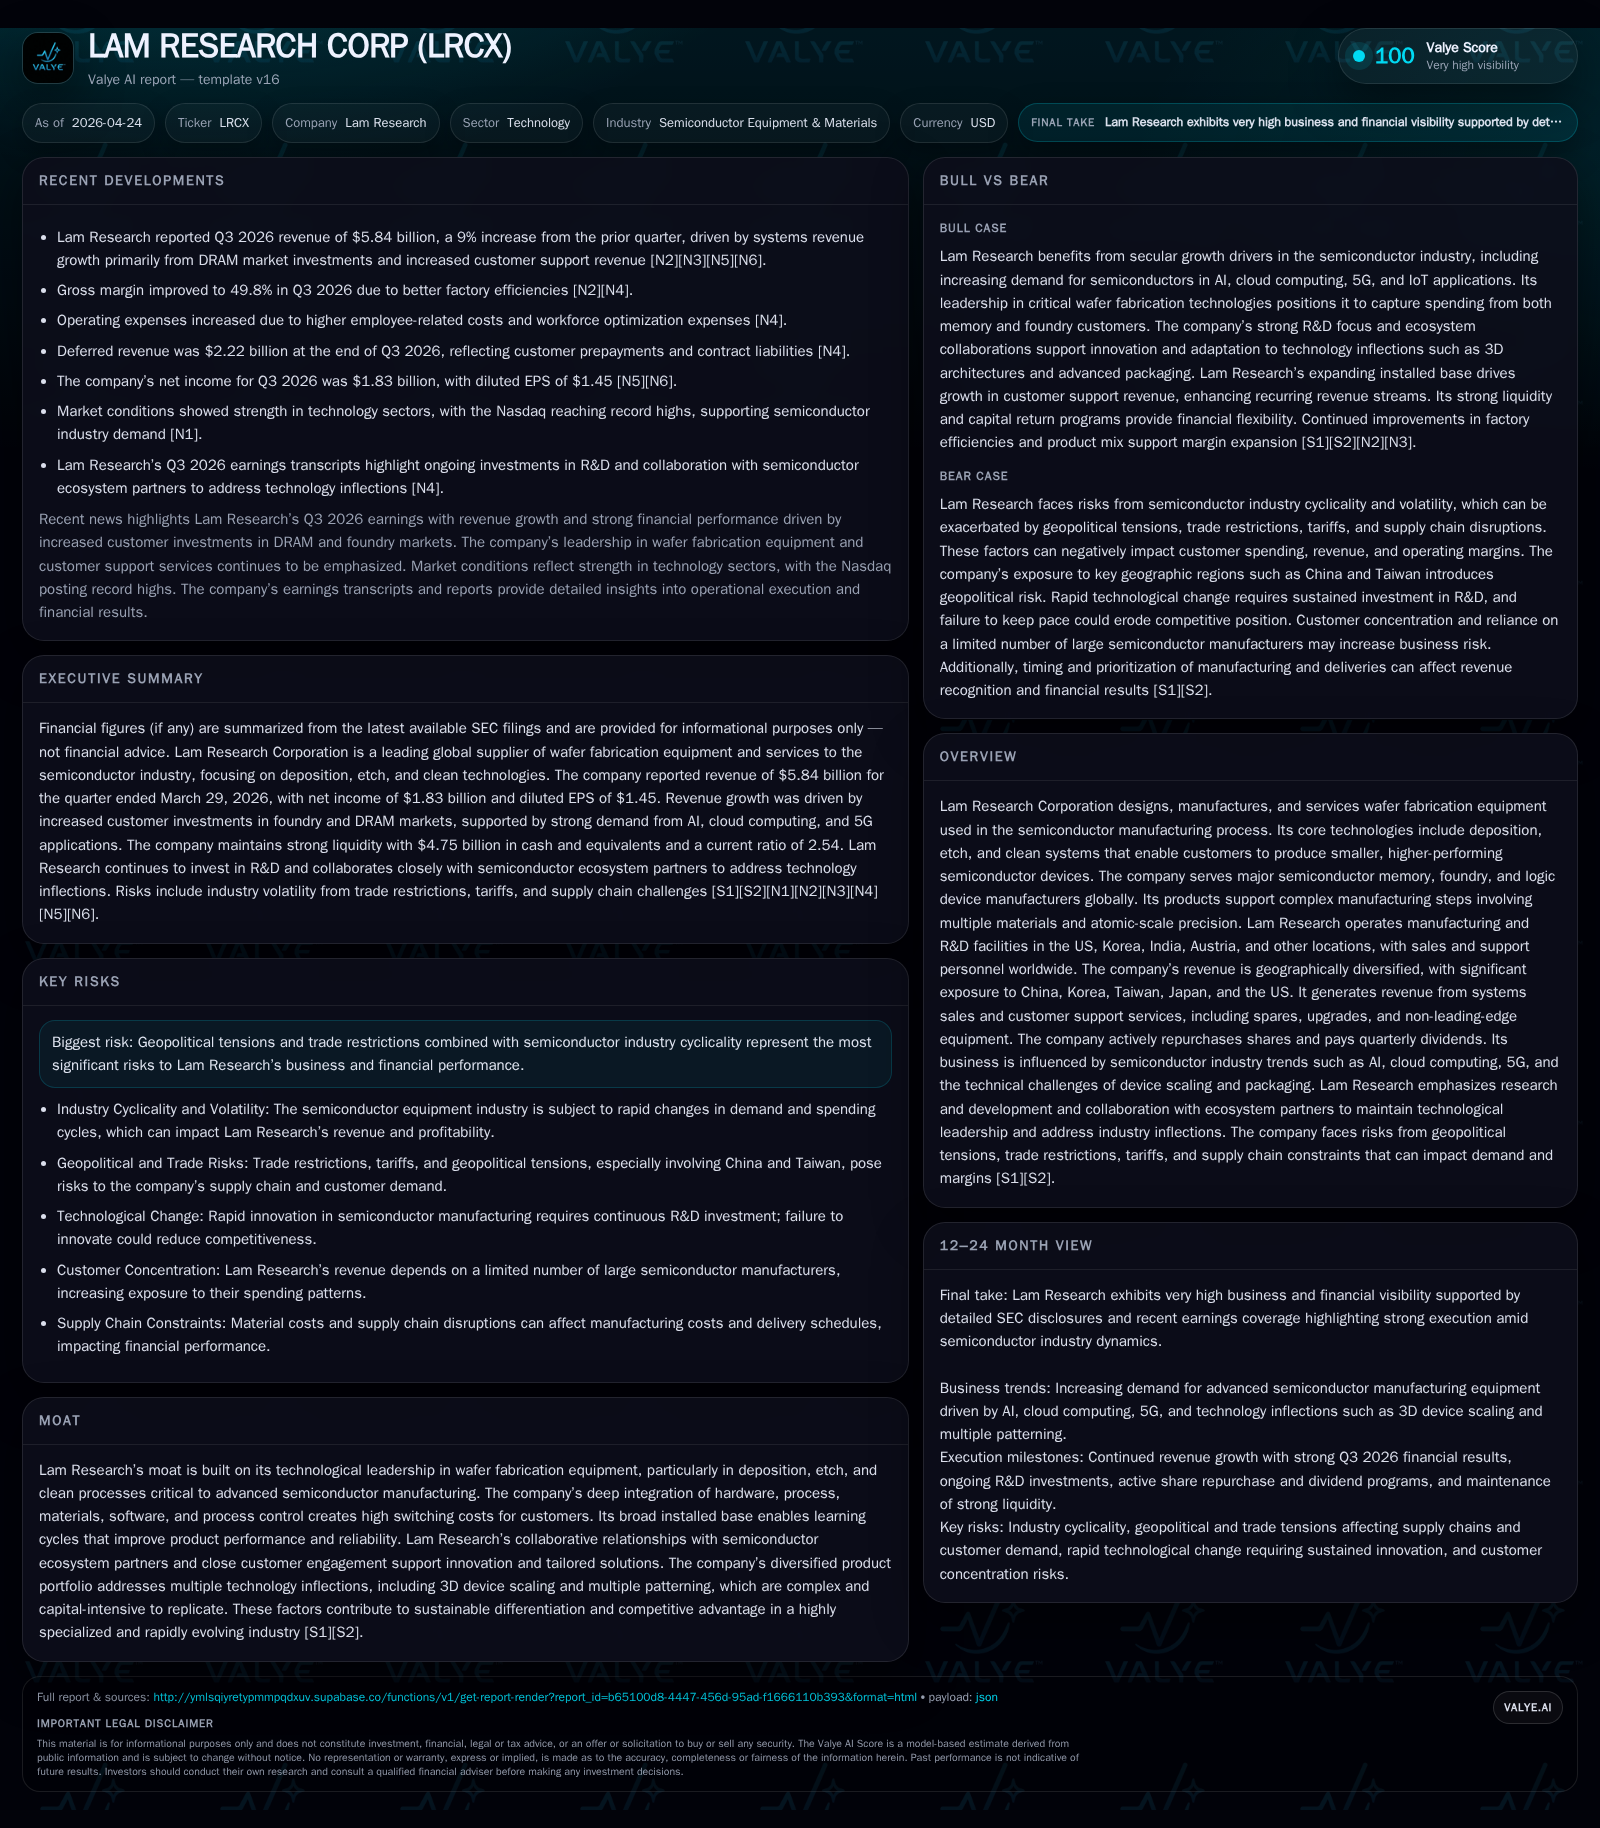
In the quarter ended March 29, 2026, Lam Research posted a 9% sequential revenue increase fueled by higher investments in the DRAM segment and growing customer support services. The company achieved gross margin expansion to nearly 50%, driven primarily by improved factory efficiencies. Its business model, centered on advanced wafer fabrication equipment and robust service offerings, positions it well to capitalize on structural growth drivers such as AI-driven memory demand and complex chip manufacturing cycles. Geopolitical risks combined with semiconductor cyclicality remain key constraints. Looking ahead, management emphasizes operational readiness to meet rising demand while maintaining financial strength reflected in strong cash flow and prudent capital allocation.
Q3 Operating Results Reflect Improved Factory Efficiency and Revenue Growth
Lam Research’s fiscal Q3 ending March 29, 2026 ([S2]) demonstrated robust operational execution with total revenue reaching $5.84 billion—a 9% increase from $5.34 billion in the prior quarter. This uptick was largely driven by systems revenue growth linked to increased customer investments in the DRAM segment along with rising customer support-related revenue tied to its expanding installed base. Customer spend for non-leading-edge equipment dipped somewhat but was offset by stronger sales in spares, upgrades, and services.
Gross margin as a percentage of revenue improved modestly to 49.8%, up from 49.6% last quarter; this improvement was mainly due to factory efficiency gains despite some headwinds from tariffs and a shift in product mix ([S2], [S6]). Operating expenses increased slightly as employee-related costs reflected seasonality and headcount growth but were managed within guidance.
Cash flow generation remained very healthy with $4.4 billion provided by operating activities during the nine months ended March 29, driven by net income of nearly $5 billion over the same period ([S2]). This cash flow strength underpins ongoing capital spending—including $331 million invested in manufacturing capacity—and aggressive capital returns via share repurchases and dividends.
Business Model: Precision Wafer Fabrication Equipment and Customer-Centric Support Services
Lam Research designs, manufactures, and services highly specialized wafer fabrication equipment essential for semiconductor production steps requiring atomic-scale precision. Its core equipment categories include deposition (material layering), etching (pattern removal), and wafer cleaning systems ([S1]). These processes support device scaling trends like vertical architectures (e.g., 3D NAND) and multiple patterning critical for sub-nanometer nodes.
Beyond new system sales, a significant portion of Lam’s revenues comes from its customer support business—offering spares, upgrades, maintenance contracts, and non-leading-edge equipment sales via its Reliant® product line ([S4], [S15]). This aftermarket focus enhances switching costs as customers rely on Lam’s distinctive integration of hardware, process controls, materials expertise, and software capabilities.
The company maintains a geographically diversified manufacturing footprint spanning North America (California, Oregon), Asia (Korea, India), Austria (Salzburg/Villach), alongside broad sales/support teams worldwide ([S1]). This global presence supports close engagement with leading memory makers (DRAM/NVM), leading foundries deploying advanced logic nodes, and IDM customers driving integrated device manufacturing technologies.
Competitive Dynamics in the Semiconductor Equipment Industry
Lam Research operates within a concentrated market characterized by high technological barriers due to the complexity of deposition/etch/clean challenges at advanced nodes ([S1], [S7]). Its moat stems from decades of accumulated installed base learning cycles that refine process performance and reliability plus collaborative ecosystem relationships fostered with leading semiconductor OEMs.
Unlike lithography equipment dominated by ASML's EUV leadership—a complementary domain—Lam holds distinct competitive edges in frontier etch/deposition techniques crucial for enabling next-generation device architectures ([N11]). Capital intensity for developing novel process capabilities ensures sustainable differentiation against smaller or newer entrants.
High switching costs arise because Lam’s multi-product portfolio addresses several critical process inflections simultaneously while integrating tightly with customer-specific process recipes—difficult for competitors to replicate at scale ([S1]). Maintaining superior yield outcomes helps secure repeat orders and extended aftermarket engagements.
Drivers of Growth: AI, Memory Demand, and Technology Inflections
The secular shift toward AI-driven computing workloads underpins elevated demand for both memory (notably DRAM) and advanced logic capacity expansions ([S7]). Lam benefits structurally as these trends necessitate increasingly complex fab toolsets capable of supporting tight process control amidst vertical device scaling trends such as three-dimensional stacking.
Multi-patterning complexity also persists as an industry paradigm given lithographic resolution limits; this sustains demand for Lam’s deposition/etch innovations enabling feature definition below single-exposure thresholds ([S7]).
Foundry spending elevated sequentially though balanced by moderate near-term variation due to mature node adjustments; memory spending held steady or increased amid heightened DRAM investments ([S15]). The combined growth drivers suggest strong medium-term TAM expansion potential beyond cyclic fluctuations common in semi equipment sectors.
Risks and Constraints: Geopolitical Tensions and Cyclical Industry Factors
Lam Research explicitly highlights geopolitical tensions—especially U.S.-China trade restrictions—as material risk vectors that can introduce volatility or dampen near-term orders ([S11], [S13]). Supply chain complexities linked to tariff impacts or export control measures can affect cost structures or delivery schedules.
Additionally, the semiconductor equipment industry remains inherently cyclical influenced by end-market demand swings across smartphones, PCs, cloud infrastructure, automotive electronics among others. While secular AI/memory trends provide structural uplift; episodic downturns can emerge due to macroeconomic slowdowns or inventory corrections impacting Lam’s operating cadence.
Looking Ahead: Guidance, Market Adoption Signals, and Execution Focus
While explicit quarterly guidance is not detailed in filings as of Q3 FY2026 close ([S2], [S3]), management commentary emphasizes readiness to capitalize on AI-related semicon spending rebounds while balancing delivery timing with supply chain constraints ([N3]).
Investors should monitor order backlog evolution particularly in DRAM-related systems segments along with further advances sustaining gross margin improvement through enhanced factory throughput efficiencies.
Operational execution including targeted R&D spend increases (~10% of revenue) will be critical to maintaining technology leadership across deposition/etch/clean domains relevant for upcoming node transitions ([S25]).
Financial Overview: Cash Flow Strength, Capital Allocation, and Balance Sheet Position
At quarter-end March 29, 2026 Lam reported approximately $4.77 billion in cash and equivalents with a strong current ratio near 2.54 reflecting solid liquidity resources relative to liabilities totaling about $5.24 billion current liabilities ([F1], [S2]). Total debt at end of last fiscal year stood near $4.5 billion with net debt effectively negative when valued against cash balances ([F1]).
Operating cash flow reached around $4.40 billion over nine months through March reflecting strong earnings conversion capacity supported by favorable working capital movements including inventory reductions totaling $224 million during Q3 alone ([S2], [S26], [S22]).
Capital expenditures approximated $780 million YTD representing continued investments in manufacturing infrastructure ensuring capacity alignment with upcoming demand waves ([S10], [F1]).
The company maintained active capital returns programs with $3.60 billion deployed towards treasury stock repurchases during nine months including accelerated share buyback agreements initiated recently alongside dividend payouts near $945 million reflecting steady shareholder returns commitment ([S9], [S20], [F1]).
Historical performance (annual)
| FY | Net ($bn) | CFO ($bn) | OpInc ($bn) | Capex ($mm) | Net YoY |
|---|---|---|---|---|---|
| 2025 | 5.4 | 6.2 | 5.9 | 759 | +40.0% |
| 2024 | 3.8 | 4.7 | 4.3 | 397 | -15.1% |
| 2023 | 4.5 | 5.2 | 5.2 | 502 | -2.0% |
| 2022 | 4.6 | 3.1 | 5.4 | 546 |
Source: SEC companyfacts cache [F1].
Capital returns and efficiency (annual)
| FY | Div ($mm) | Buybacks ($bn) | FCF ($bn) |
|---|---|---|---|
| 2025 | 1150 | 3.4 | 5.4 |
| 2024 | 1019 | 2.8 | 4.3 |
| 2023 | 908 | 2.0 | 4.7 |
| 2022 | 815 | 3.9 | 2.6 |
Source: SEC companyfacts cache [F1].
Disclaimer: This analysis is based exclusively on publicly available SEC filings including the latest quarterly report filed April 23, 2026 [S2] and related documents without speculation or forecasts beyond stated company disclosures or industry facts noted explicitly above.
Disclaimer: This is research-only, informational analysis and not investment advice. It may include AI-generated interpretation and general industry context. Always verify important details using primary sources.
Comments